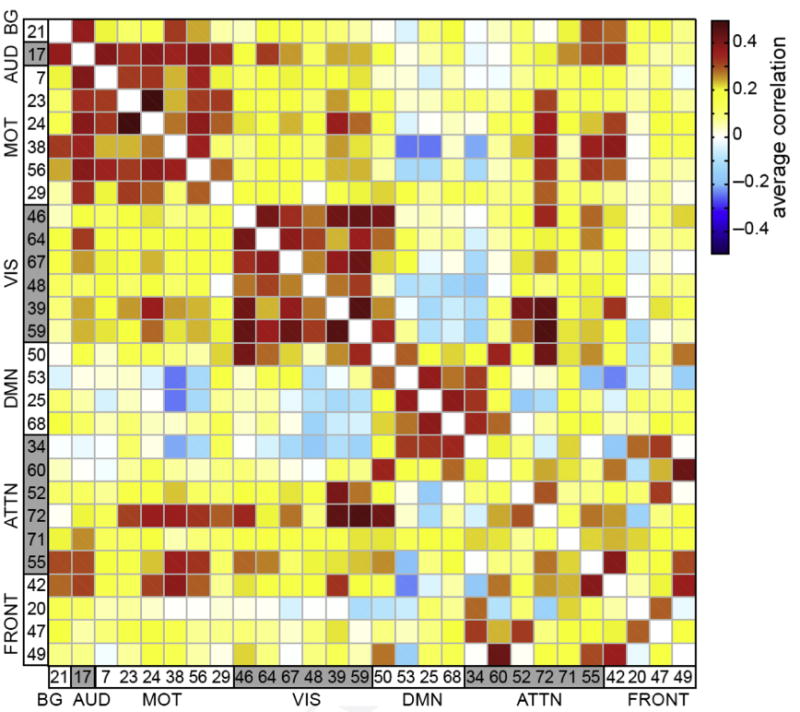
Fig. 6.

Example of FNC. The component maps are ordered as shown in Fig. 5. Considerable modularity is observable within the matrix; for example, visual and motor regions tend to be most highly correlated with themselves and the default mode network is showing anticorrelation with multiple other networks. (Modified from Allen EA, Erhardt EB, Damaraju E, et al. A baseline for the multivariate comparison of resting-state networks. Front Syst Neurosci 2011;5(2):2.)
