
Fig. 7.
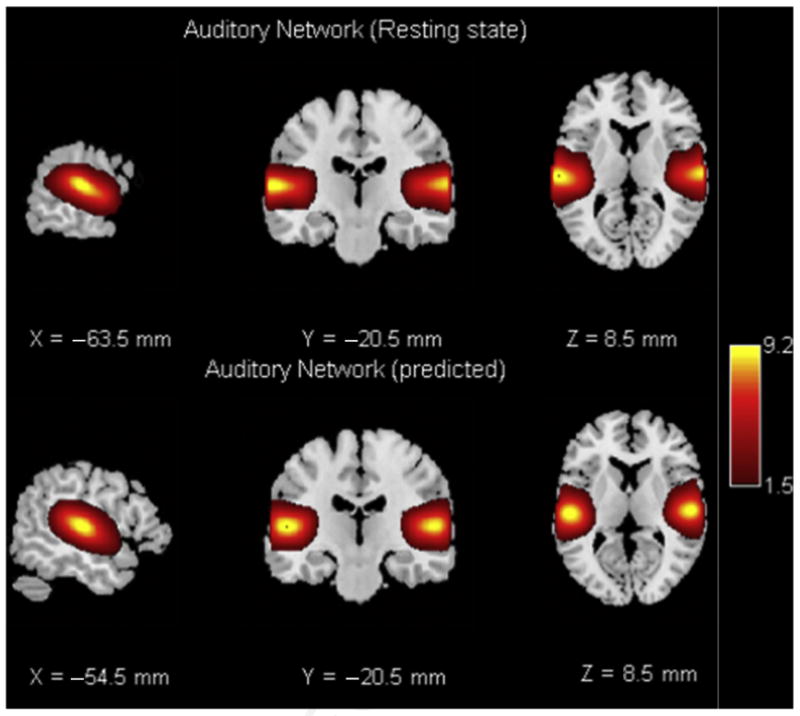
The top row shows a temporal lobe component from resting-state analysis and the bottom row is a predicted temporal lobe component from a different data set.
Official websites use .gov
A
.gov website belongs to an official
government organization in the United States.
Secure .gov websites use HTTPS
A lock (
) or https:// means you've safely
connected to the .gov website. Share sensitive
information only on official, secure websites.
The top row shows a temporal lobe component from resting-state analysis and the bottom row is a predicted temporal lobe component from a different data set.