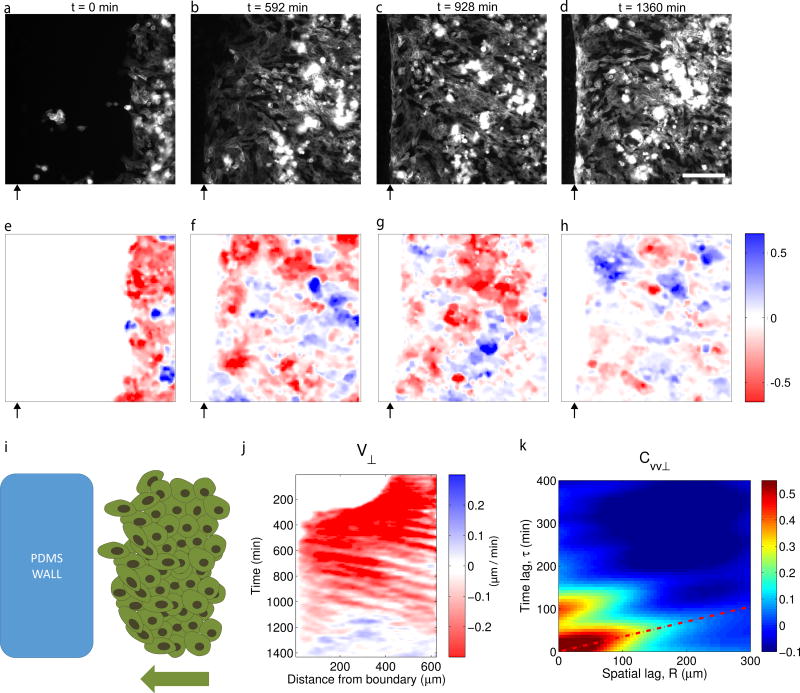
Figure 5. Deformation waves are a generic feature of repulsive interfaces during jamming.
a–d, Fluorescence images of MDCK cells expressing EphB2 and lifeact-CFP during collision against a PDMS wall. e-h, Velocity component Vx corresponding to the time points indicated in a-d. Black arrows indicate the position of the wall. Scale bar, 150 µm. i, Scheme of the experimental design. j, Kymograph of velocity V⊥. k, Autocorrelation function of V⊥ after contact with the block. Average period between propagation events was 85±9 min. Average propagation velocity was 171±2 µm/h. Data are representative of n=3 independent experiments.

