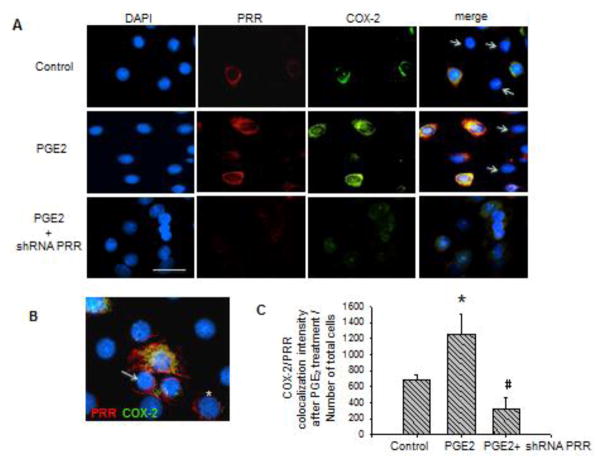
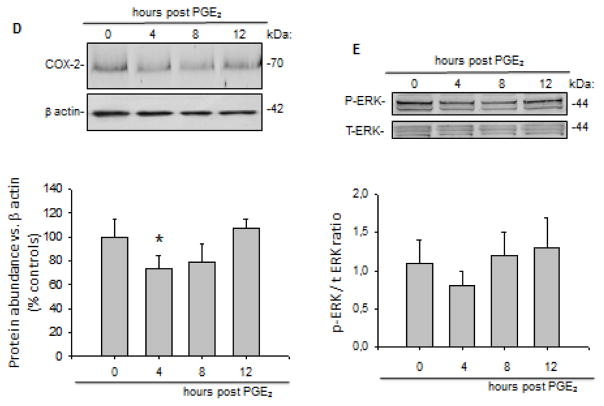
FIGURE 4.
(A) Co-localization of the (pro)renin receptor (PRR) and the cyclooxygenase-2 (COX-2) indicating the effect of prostaglandin E2 (PGE2) treatment (12 h) and the effect of shRNA PRR on the decreased expression of COX-2 within the cells. Quantification of merge intensity is shown at the bottom. *P < 0.05. Scale bar = 10 μm. Arrow represent negative labeling for PRR and COX-2, probably principal cells. (B) PRR-COX-2 co-localization: PRR (red) is expressed in M-1 cells (probably intercalated cells), which are also positive for COX-2 (green). PRR was observed in the plasma membrane (arrows) and in a peri-nuclear distribution (asterisk) probably associated to the V-ATPase. (C) Quantification of PRR-COX-2 merge intensity after treatments. (D) Temporal protein expression profile of COX-2 in cells at 4, 8, and 12 h post PGE2 treatment in M-1 CD cells transfected with PRR shRNA. *P < 0.05 vs. control. (E). Phosphorylated extracellular signal–regulated kinase (ERK) versus total ERK ratio at 4, 8, and 12 h post PGE2 treatment in cells transfected with PRR shRNA.


