
Figure 1. DCs utilize intracellular glycogen metabolism upon LPS stimulation.
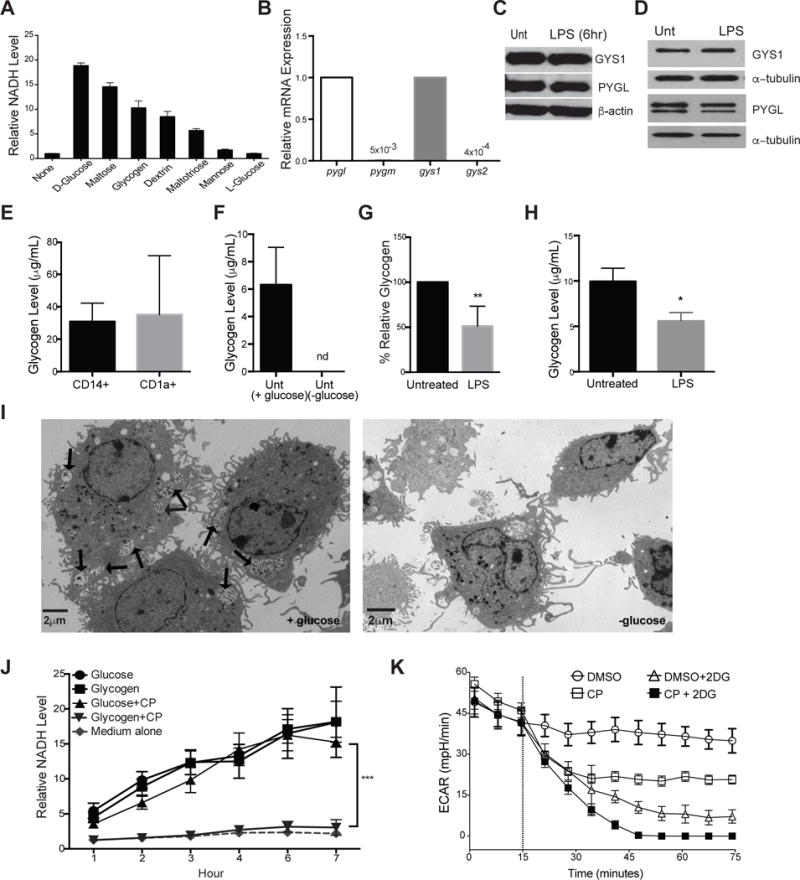
(A) BMDCs were cultured in the indicated substrates as the sole nutrient sources and measured for ability to produce NADH as described in the methods. Data indicate relative NADH production at 6 hrs normalized to no carbon source controls, n=3. (B) Relative mRNA expression of pyg and gys isoforms in naive BMDCs. (C–D) PYGL, GYS1, and β-actin protein expression in unactivated and 6hr LPS-stimulated BMDCs (C) and 24hr LPS-stimulated moDCs (D). (E–H) Intracellular glycogen levels of: human peripheral blood CD14+ monocytes and CD1a+ DCs (E), untreated BMDCs cultured overnight in ±glucose (F), BMDCs (G) and moDCs (H) stimulated ±LPS in 5mM glucose (n=3–6, mean ±SD, student’s t-test, *P<0.05, ** P=0.0021, nd= not detected). Glycogen levels were normalized to 10ˆ5 cells. (I) TEM images of unactivated BMDCs in 5mM glucose (left) and 0mM glucose (right), with arrows indicating intracellular glycogen deposits identified by tannic acid staining. (J) NADH levels over time in BMDCs cultured in glucose or glycogen containing media (as in A) ±CP (n=4, mean±SD, ***P <0.0001). (K) Basal ECAR of resting BMDCs treated with CP, 2DG, or both (treatment introduced at dotted line), representative of at least 3 replicates.