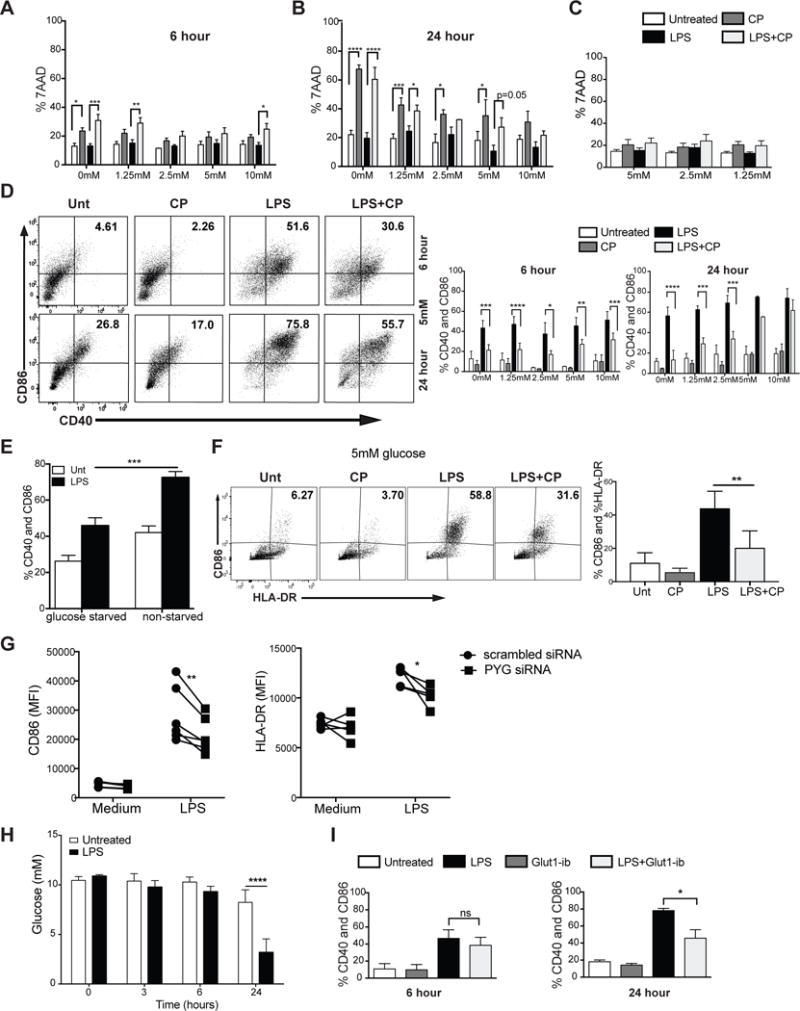
Figure 2. Glycogen metabolism supports survival and early maturation of TLR-activated DCs.

(A–B) 7AAD viability staining of BMDCs stimulated with LPS ± CP for 6hrs (A) and 24hrs (B) at 5mM glucose. (C) 7AAD viability staining of moDCs stimulated with LPS ± CP for 24hrs. (D) BMDCs were stimulated for 6 and 24 hours and analyzed for CD40 and CD86 surface expression. (E) CD40 and CD86 expression of BMDCs stimulated for 6 hrs in free glucose medium with and without glucose starvation. (F) CD86 and HLA-DR expression of moDCs stimulated with LPS±CP for 24hrs in 5mM glucose. (G) CD86 and HLA-DR surface expression of 24hr LPS-stimulated moDCs silenced with control (scrambled) or PYG-targeted siRNA. (H) Glucose measurements from supernatant of BMDCs stimulated with LPS for 3, 6, and 24 hrs. (I) CD40 and CD86 surface expression of BMDCs stimulated ±GLUT1-inhibitor in normal glucose for 6 and 24hr. (A–F, H–I) n=3–6, mean±SD, Two-way ANOVA with Tukey Post-test, *P≤0.05 ***P=0.0006 ****P<0.0001. (G) n=5, Paired t-test, *P=0.04, **P=0.0093.
