
Figure 3. PYGL inhibition attenuates immune effector functions of DC.
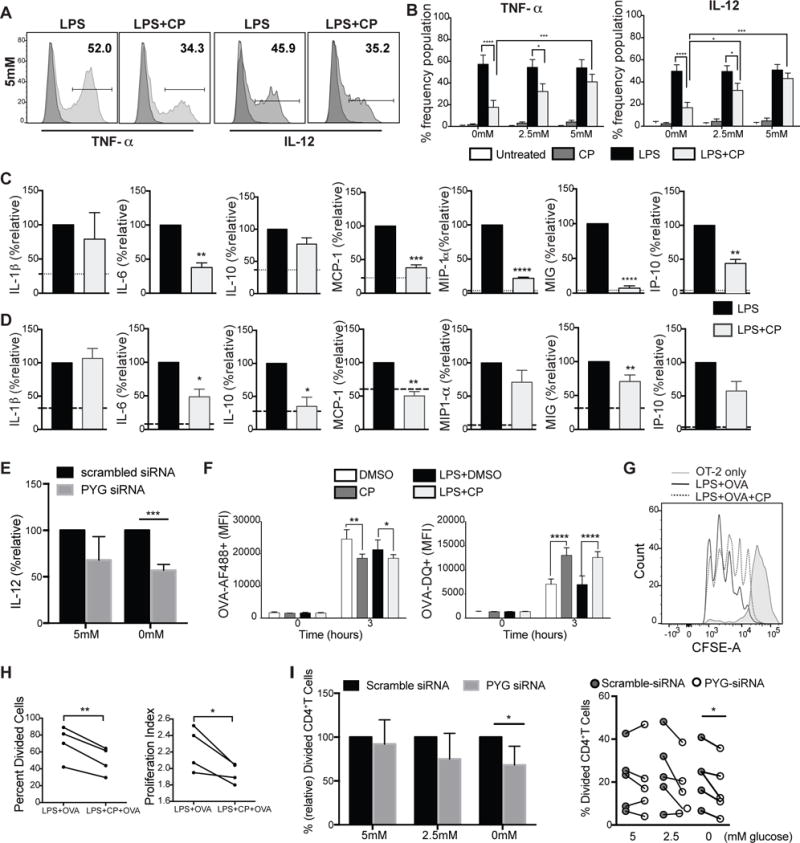
(A–B) Intracellular staining of TNF-α and IL-12 of BMDCs stimulated with LPS for 4 hrs in 5mM glucose. (C–D) Multiplex panels of cytokine and chemokine measurements from the supernatant of BMDCs (C)and moDCs (D)activated with LPS for 6 hrs. Dotted lines represent unstimulated levels. (E) Relative IL-12 production by moDCs LPS-stimulated for 24hrs transfected with control or PYG-targeted siRNA. (F) BMDCs treated with LPS ±CP plus OVA-AF488 or OVA-DQ for 3 hours and analyzed by flow cytometry for antigen uptake and processing. (G) BMDCs were pulsed for 6 hours with indicated treatments and subsequently co-cultured with CFSE-labeled OT-II Tcells. CFSE dilution was measured on day 3 post co-culture. (H) Measurements of proliferation of OT-II T cells (from (G)) stimulated by BMDCs pre-treated with indicated conditions. (I) si-RNA transfected moDCs were co-cultured with CellTrace Violet –labeled human naïve CD4+T cells for 4 days. Data were normalized to scrambled siRNA. Proliferation was measured after 4 days. (A–I) n=3–5, mean±SD, (B, F) 2-way ANOVA Tukey Posttest. (C–E, H–I) student’s t-test, *P≤0.05, **P<0.001, ***P=0.0004, ****P<0.0001.