
Figure 2. SUFU functions as a BH3-only protein.
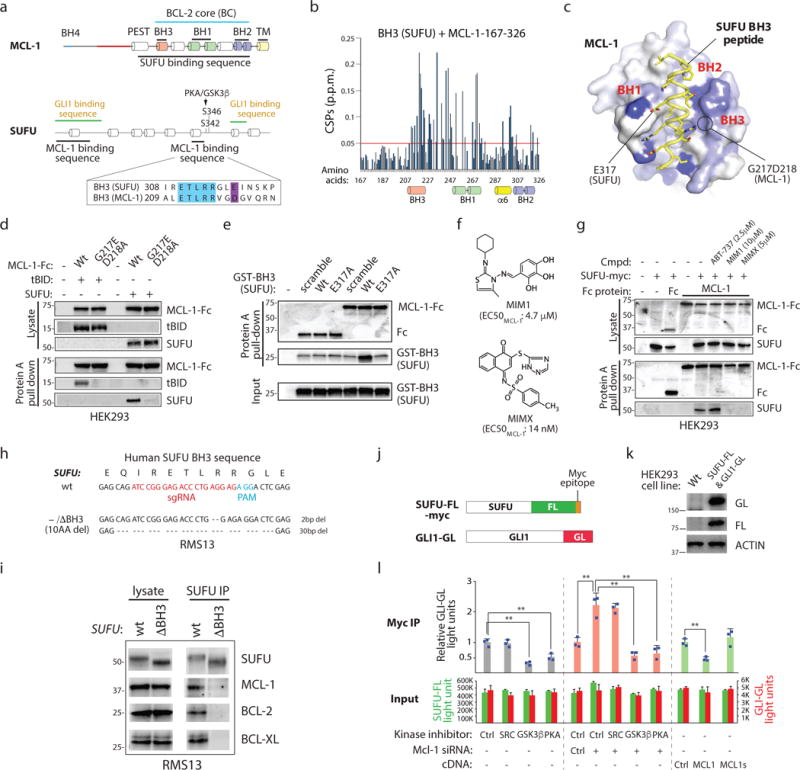
(a) The MCL-1 BC interacts with a SUFU BH3 sequence. Minimal interaction domains were identified by co-IP. Raw data is found in Supplementary Fig. 2a–e. Blue: residues identical in SUFU and MCL-1 BH3 sequences. (b) Backbone 1H–15N chemical shift perturbations (CSPs) of 15N-labeled MCL-1 induced by SUFU BH3 map within the BC groove (BH1, BH2 and BH3) and helix 6. (c) The CSPs in (a) were color coded from blue to white (large to small) onto the surface representation of a SUFU BH3–MCL-1 complex model built based on threading the SUFU BH3 onto the MCL-1 SAHB–MCL-1 complex26. SUFU E317 corresponds to an acidic residue essential to BH3/BC interactions. G217 and D218 are essential for MCL-1 interaction with BH3 sequences. (d) Residues essential for MCL-1 BC/BH3 domain interaction are required for MCL-1/SUFU binding. MCL-1-Fc = MCL-1-immunoglobulin heavy chain fusion protein. (e) The SUFU BH3 sequence is sufficient for MCL-1 interaction. Glutathione-S-transferase = GST protein. (f) Structure of chemicals targeting the MCL-1 BC groove. (g) MCL-1 inhibitors disrupt MCL-1/SUFU binding. ABT-737 = negative control. (h) SUFU genomic sequence in CRISPR-Cas9-edited RMS13 cells expressing SUFU lacking a BH3 sequence. (i) Co-IP of SUFU with prosurvival BCL-2 proteins is dependent upon the SUFU BH3 sequence. SUFU lacking an intact BH3 sequence (10AA del) fails to co-IP with prosurvival BCL-2 proteins. (j) A luciferase strategy for monitoring SUFU/GLI interactions. SUFU/GLI association is quantified by the relative FL and GL signal in antibody-isolated material. (k) Western blot analysis of a cell line expressing SUFU-FL and GLI1-GL. (l) MCL-1 regulates GLI-SUFU interaction. SUFU/GLI interaction is sensitive to PKA, GSK3β, and MCL-1 activity changes. MCL-1s = C-terminally truncated splice variant (n=3 independent measurements). All error bars represent mean ± s.d. Source data are available in Supplementary Table 4. Unprocessed blots are provided in Supplementary Fig. 7. Statistical significance was calculated using Student’s t-test, **P < 0.01.