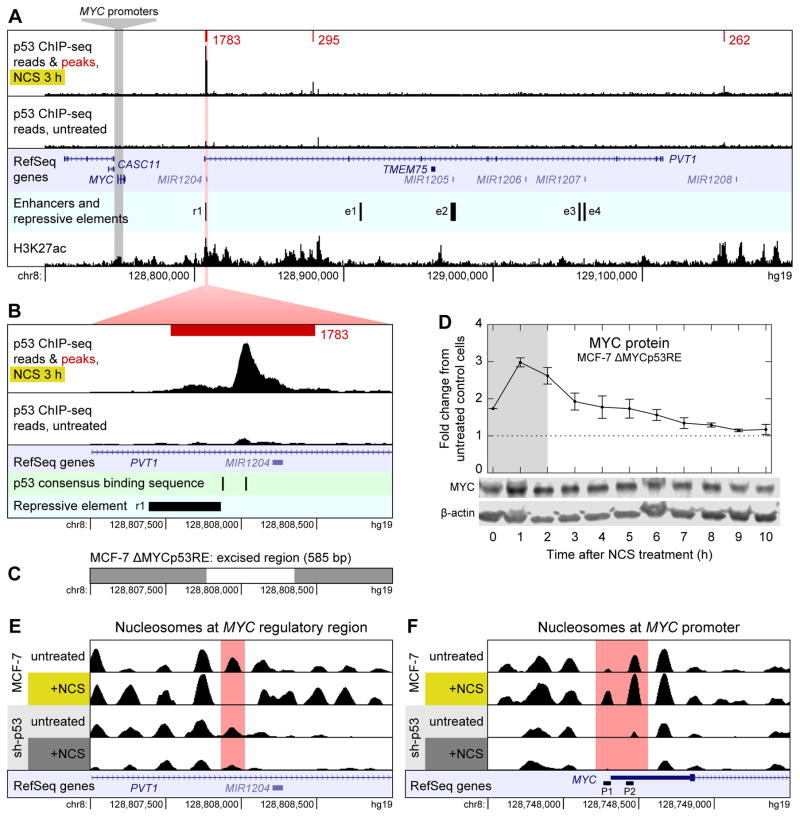
Figure 2.
Mechanism of p53-mediated repression of MYC. (A) ChIP-seq reads for p53 binding near MYC in MCF-7 cells treated with NCS for 3 h (top track) and untreated MCF-7 cells (second track) are shown along with p53 binding peaks (red) and their scores as called by MACS. Read counts are normalized to total reads for each treatment. Peaks shown are the intersection of those identified in n = 2 biological replicates. All peaks in a 1-Mb-wide window centered on MYC are shown. Untreated cells had no p53 binding peaks in this window. RefSeq annotated genes are shown (third track); enhancers and repressive element (fourth track) were identified by Fulco et al. (2016). H3K27ac ChIP-seq reads (bottom track) are from the ENCODE project (Dunham et al., 2012). (B) Close-up view of the largest p53 binding peak shown in (A). p53 consensus binding motifs RRRCWWGYYY (El-Deiry et al., 1992) are shown in addition to data in (A). (C) Region of chromosome 8 excised by CRISPR/Cas9 to generate MCF-7 ΔMYCp53RE cell line. (D) Levels of MYC protein were measured by western blotting in NCS-treated MCF-7 ΔMYCp53RE cells. Measurements are normalized to those in untreated MCF-7 CRISPR-control cells. Data are represented as mean ± SEM (n = 3). (E) Nucleosomes in the region of chromosome 8 shown in (B) in MCF-7 and MCF-7 sh-p53 cells, treated with NCS for 3 h or not treated. Nucleosomes were identified by DANPOS from ATAC-seq data. RefSeq annotated genes are shown (bottom track). (F) Nucleosomes around the MYC promoter. RefSeq annotated genes are shown along with alternate MYC promoters P1 and P2 (bottom track). See also Figure S1.

