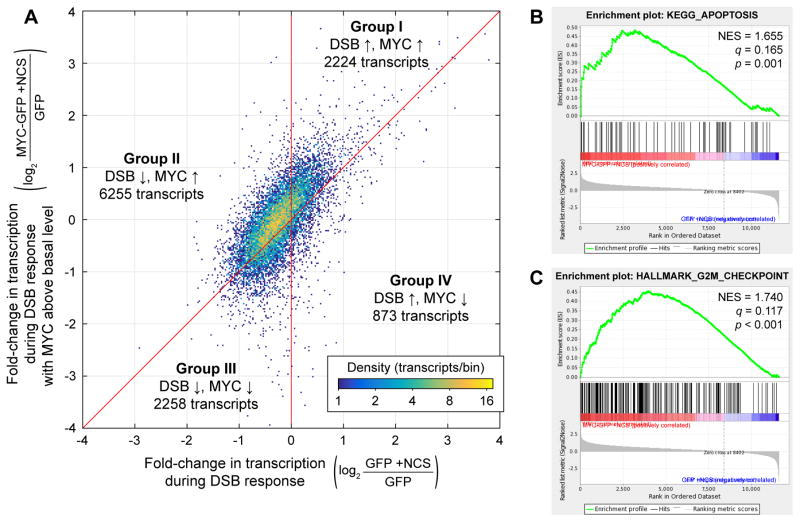
Figure 5.
Effects of MYC levels on the transcriptome during the DNA DSB response. (A) Density plot of fold-changes in mean transcription in NCS-treated MYC-GFP cells (n = 3) relative to untreated GFP cells (n = 3) vs. fold-changes in mean transcription in NCS-treated GFP cells (n = 3) relative to untreated GFP cells (n = 3). Transcripts are divided into Groups I–IV based on their fold-change due to the DSB response and their fold-change due to MYC held above its basal level during the DSB response. (B–C) Examples of apoptosis- and cell cycle-related gene sets found to be significantly enriched in NCS-treated MYC-GFP cells over NCS-treated GFP cells. Normalized enrichment scores (NES), false discovery rate q-values, and nominal p-values are shown. See also Figure S3 and Table S2.

