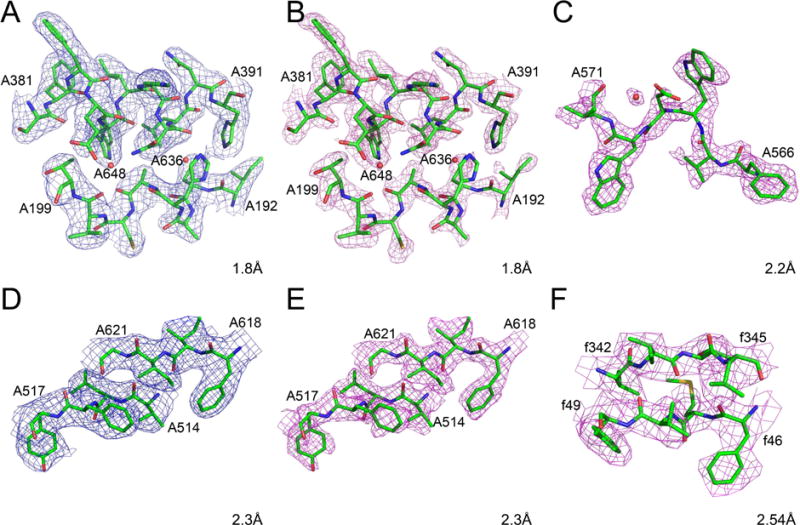
Figure 2.

Cryo-EM maps and models for fragments of selected high-resolution protein structures. The raw maps are colored blue and the sharpened maps magenta. A–B) Glutamate dehydrogenase, residues A192-A199, A381-A391, and waters A636 and A648. C) β-galactosidase, residues A566-A571 and water A5035. D–E) P97 with inhibitor, residues A514-A517 and A618-A621. F) T. cruzi 60S ribosomal subunit, residues f46-f49 and f342-f345. The grid for all maps is as deposited, and the contour levels are 3σ, with the exception of panel F, contoured at 1.5σ.
