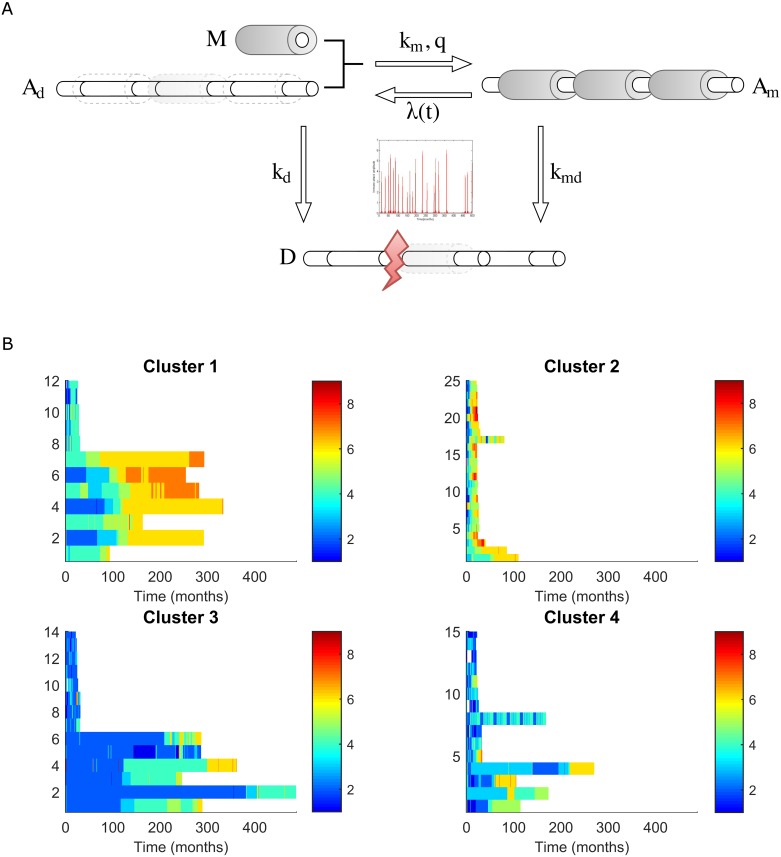
Fig 2. The ODE model of CNS damage in MS.
A) The model represents the volume occupied by axons and myelin: Right, the healthy CNS is composed of myelinated axons (Am); Center, inflammatory attack is represented by the time-dependent parameter λ(t), which arises from the Generalized Extreme Value (GEV) distribution of the EDSS time-series, producing either demyelination (right) or degeneration of axons (bottom); Left, demyelinated axons (Ad) can be remyelinated with myelin produced by oligodendrocytes (M), as a function of the parameters km and q; Bottom, myelinated or demyelinated axons can be lost by either acute axon transection or degeneration (D), according to the parameters kmd or kd respectively. B) Clustering MS patients based on the EDSS time series. The horizontal axes correspond to the time in months (maximum = 16 months), while the vertical axes correspond to the patients. Each line represents the EDSS of a given patient over time, using a color scale to reflect the EDSS. Clusters 1 and 2 include patients that maintain an intermediate short term EDSS and that reach a high EDSS in the long term. Cluster 3 includes patients that maintain a low short term EDSS and that achieve an intermediate EDSS in the long term. Cluster 4 represents a more heterogeneous group.

