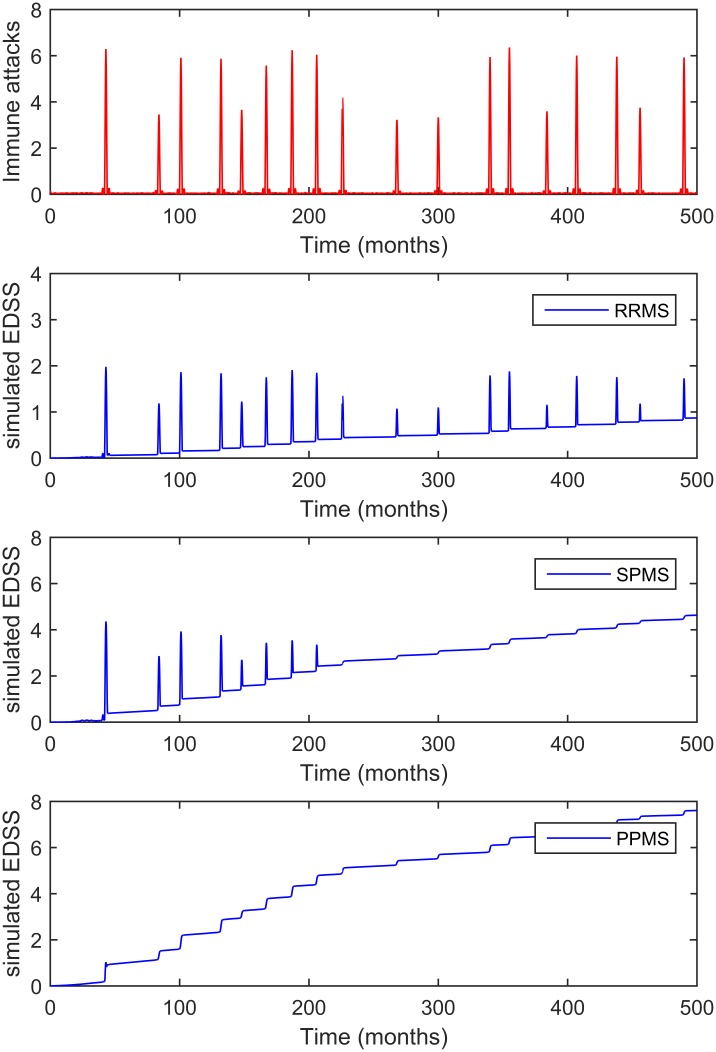
Fig 5. Simulations of the model that reproduce the MS subtypes.
The top panel shows an example of the dynamics of autoimmune attacks (derived from the T cell model and adjusted for the EDSS distribution), and the bottom panels reproduce the dynamics of the EDSS in function of the fine-tuning of the parameters defining axon degeneration and de/remyelination, reproducing the RRMS, SPMS and PPMS disease courses, respectively. In the model, each increase in the EDSS is the consequence of an inflammatory attack, yet in the progressive phenotypes (SPMS and PPMS), they are observed as small and discrete increases in the EDSS.

