
Figure 4.
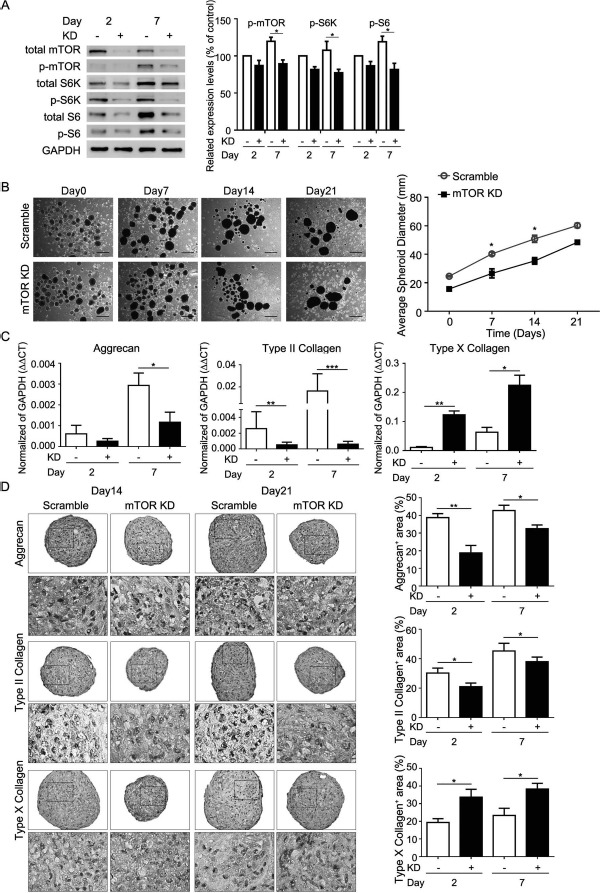
Effects of mTOR knockdown (KD) on size and chondrogenic protein expression of MSC spheroid on chitosan films. Aliquots of 2 × 10⁵ MSCs with or without mTOR KD in complete culture medium were seeded to each well of a six-well plate, coated with chitosan. Medium was replaced with chondrogenic induction medium 2 days later (Day0). (A, left) Western blot analysis of mTOR-related signaling proteins and (A, right) its quantification at indicated time periods. ∗p < 0.05 as determined by paired Student's t-test. (B, left) Morphology, (B, right) average spheroid diameter, (C) quantitative RT-PCR for mRNA levels, and (D, left) immunohistochemistry for indicated proteins of MSC spheroids at indicated time periods. (D, right) Quantification data of immunohistochemistry. Data are presented as mean + SEM (n = 3). ∗p < 0.05, ∗∗p < 0.01, ∗∗∗p < 0.001 as determined by unpaired Student's t-test. Scale bar: 500 μm. Day2, chondrogenic induction medium cultured for 2 days; Day7, chondrogenic induction medium cultured for 7 days; Day14, chondrogenic induction medium cultured for 14 days; Day21, chondrogenic induction medium cultured for 21 days; KD, MSCs with mTOR KD; Scramble, MSCs without mTOR KD.