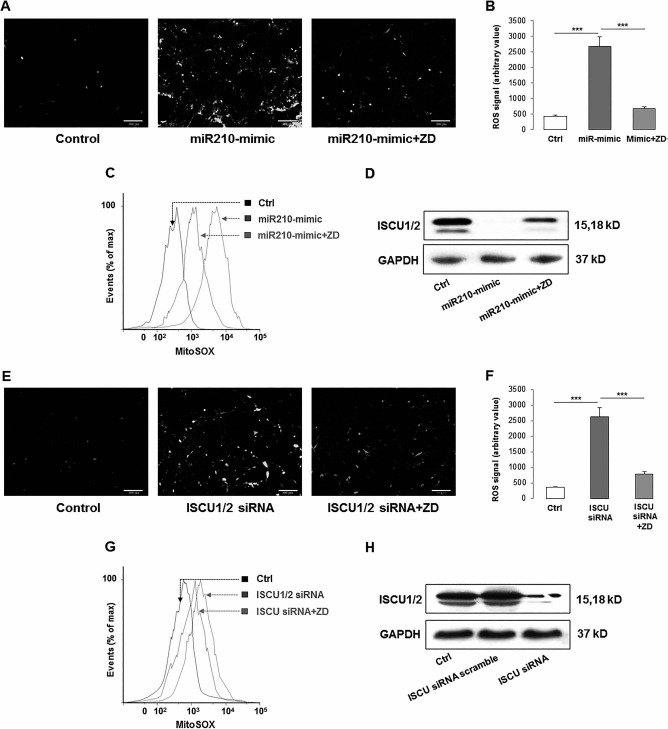
Figure 5.

Cross-regulation between miR-210 and cellular ROS generation through ISCU1/2 in hADMSCs. (A–C) miR-210 mimic induced the generation of cellular and mitochondrial ROS, while ZD ameliorated the increase of those ROS productions. (D) After miR-210 mimic treatment, the production of ISCU was significantly decreased, while ZD recovered it. (E–H) When ISCU was knocked down by specific siRNA, both cellular and mitochondrial ROS were induced but inhibited by the ZD cotreatment. (C) and (G) Higher MitoSOX readout means more severe accumulation of mitochondrial ROS. ***p < 0.001 means significant change between indicated treatment groups. Ctrl, control; ZD, zeaxanthin dipalmitate; ROS, reactive oxygen species; miR-210, microRNA-210; mitoSOX, mitochondrial superoxide indicator; ISCU1/2, iron–sulfur cluster assembly proteins 1/2; siRNA, small interfering RNA; GAPDH, glyceraldehyde 3-phosphate dehydrogenase.
