Figure 7.
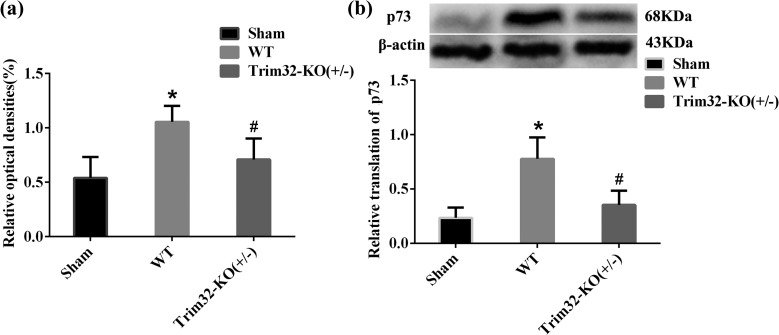
The expression of p73 at 7 d after traumatic brain injury (TBI) from TBI mice and Trim32 knockout mice (Trim32-KO [+/−]) TBI mice. (A) Reverse transcription polymerase chain reaction (RT-PCR) results of p73 in TBI mice and Trim32 KO (+/−) TBI mice. β-Actin was used as control. (B) This is to exhibit the protein level of p73. β-Actin was used as control. Lane 1 in the left side displays the protein band in the sham group, lane 2 shows the protein band in wild-type (WT)-TBI mice, and lane 3 shows the protein band in Trim32 KO (+/−) TBI mice. The relative translation of p73 was lower in Trim32 KO (+/−) TBI mice. *P < 0.05 compared with the sham group; #P < 0.05 compared with the WT-TBI group.

