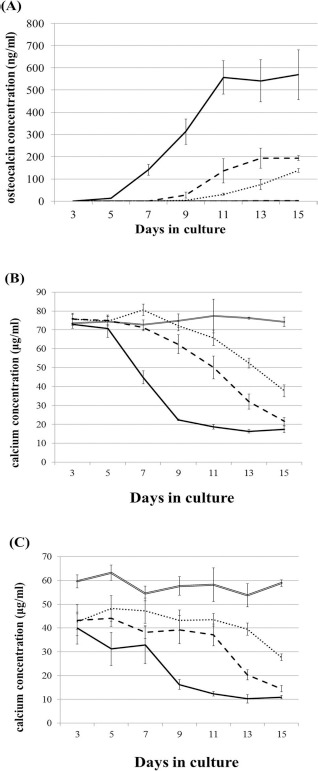
Figure 1.

Changes in osteocalcin secretion (A) and calcium concentration measured by X-ray fluorescence analysis method (B) and the commercially available kit (C) in the medium. Black, double broken, broken, dotted, and double lines indicate the data obtained from constructs of β-tricalcium phosphate (β-TCP)/passage 1 (P1), β-TCP/P2, β-TCP/P3, and control (β-TCP alone), respectively. Data are shown as the mean ± standard deviation (SD).
