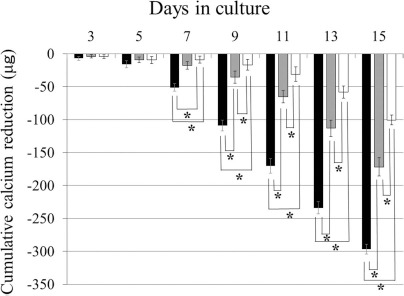
Figure 2.

Cumulative calcium reduction. The amount of calcium reduction in the β-TCP/P1 constructs (black columns) was significantly higher than that in the β-TCP/P2 (gray columns) and β-TCP/P3 (white columns) constructs. Data are shown as the mean+standard deviation SD. *p < 0.05.
