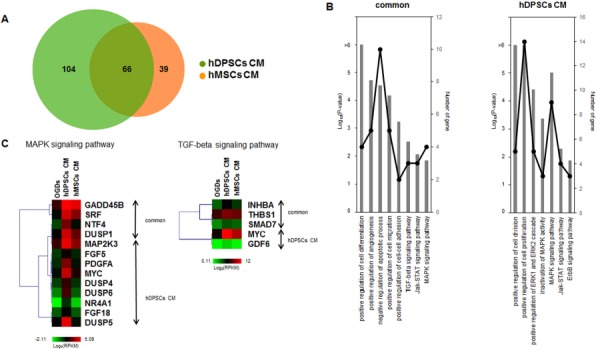
Figure 7.

Comparison of hDPSC- and hBM-MSC-treated hA gene regulation. (A) Venn diagram of upregulated genes in hDPSC- and hBM-MSC-treated hAs. Primary cultured hDPSCs and commercial hBM-MSCs were obtained from 10 and 3 donors separately. (B) GO term and KEGG pathway enrichment of genes commonly (left) and exclusively (right) upregulated between the hDPSC- and hBM-MSC-treated groups. The overrepresented pathways and the numbers of genes in the GO terms and KEGG pathways are shown as bar plots (–log10 p value) and line graphs, similar to Figure 6C. (C) Heatmaps of the mitogen-activated protein kinase (MAPK) and transforming growth factor-β (TGF-β) signaling pathways. The expression values (log2 RPKM) of upregulated genes in hDPSCs and hBM-MSCs were calculated and used to perform hierarchal clustering and for generation of heatmaps. On the right side of the heatmap, the labels show the genes upregulated in both hDPSCs and hBM-MSCs and those upregulated exclusively in hDPSCs.
