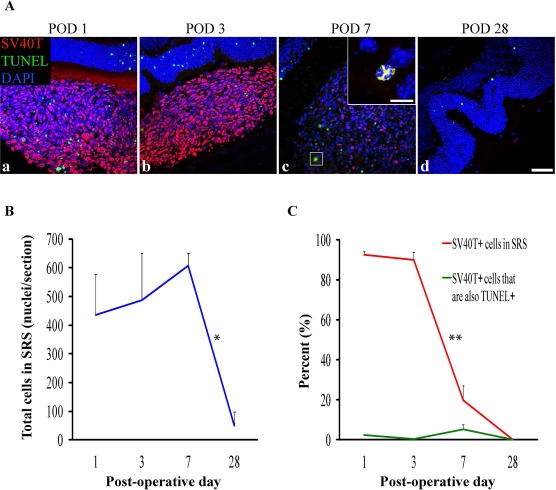
Figure 2.

DH01 retinal pigment epithelial (RPE) cells allografted to the subretinal space (SRS) of healthy nonimmunosuppressed C57BL/6 mice are lost by POD 28. (A) Representative confocal microscopy images of sections immunolabeled for SV40T (Texas Red) to identify transplanted cells and TUNEL (FITC, green) to identify DNA strand nicks in apoptotic and necrotic cells. All nuclei were counterstained with DAPI (blue). At POD 1 (a) and POD 3 (b) most cells in the subretinal bolus are graft cells (SV40T+). However, few transplanted cells are seen at POD 7 (c), and no graft cells remain at POD 28 (d). TUNEL labeling in the subretinal cell bolus remains low at each time point. High-power inset at POD 7 (c) shows an example of an apoptotic/necrotic graft cell (DAPI+/SV40T+/TUNEL+). Scale bars: 50 μm, 10 μm [high-power inset in (c)]. (B) There was no significant change in the total number of cells in the SRS between POD 1 (435 ± 143), POD 3 (487 ± 164), and POD 7 (607 ± 45), but the total cell number decreased significantly (*p < 0.05) between POD 7 (607 ± 45) and POD 28 (49 ± 49). (C) The proportion of the subretinal bolus (red line) composed of graft cells did not change significantly between POD 1 (93 ± 1%) and POD 3 (90 ± 4%). However, there was a significant (**p < 0.001) reduction in the proportion of the subretinal bolus composed of graft cells between POD 3 (90 ± 4%) and POD 7 (20 ± 7%). No graft cells survived to POD 28. Levels of graft cell apoptosis/necrosis (DAPI+/SV40T+/TUNEL+) (green line) were low at each time point (POD 1: 2 ± 0.3%; POD 3: 0.4 ± 0.3%; POD 7: 5 ± 2%) and did not differ significantly between time points.
