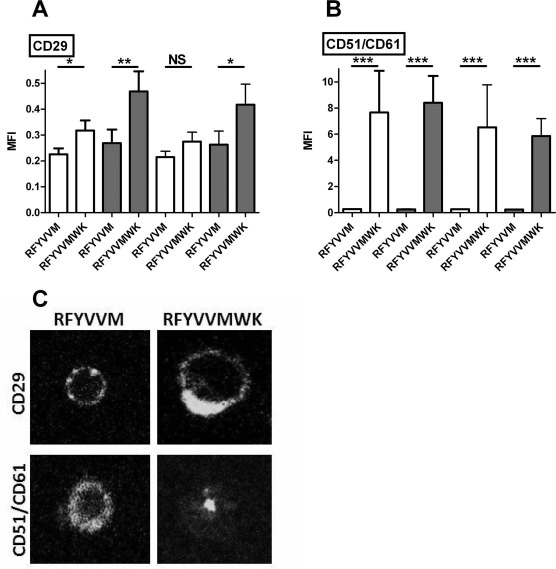
Figure 2.

Expression of CD29 (A) and CD51/CD61 (B) on CD34+/CD42b+ conjugates and CD34+/CD42b− cells after RFYVVM or RFYVVMWK preconditioning. (C) Examples of CD29 (top) and CD51/CD61 (bottom) distribution on RFYVVM (left)- and RFYVVMWK (right)-stimulated cells observed by confocal microscopy are shown. MFI, mean fluorescence intensity; T2D, type 2 diabetes (gray bars); non-T2D, nondiabetic (white bars); NS, not significant. ∗p < 0.05; ∗∗p < 0.01; ∗∗∗p < 0.001 (ANOVA).
