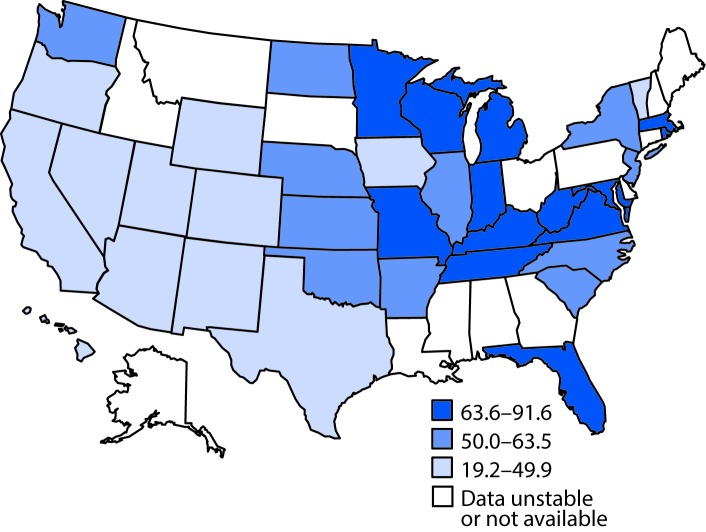
FIGURE 2.
Age-adjusted* hospitalization rate† (per 100,000 population) for any-listed diagnosis§ of Crohn’s disease — State Inpatient Databases, 2013
* Age-adjusted to the 2000 projected U.S. population.
† Estimates considered unstable if relative standard error >30%.
§ Any-listed Crohn’s disease diagnosis indicates that patients had Crohn’s disease, but Crohn’s disease was not necessarily the main reason they were being hospitalized.

