. 2017 Mar 17;66(10):265–269. doi: 10.15585/mmwr.mm6610a1

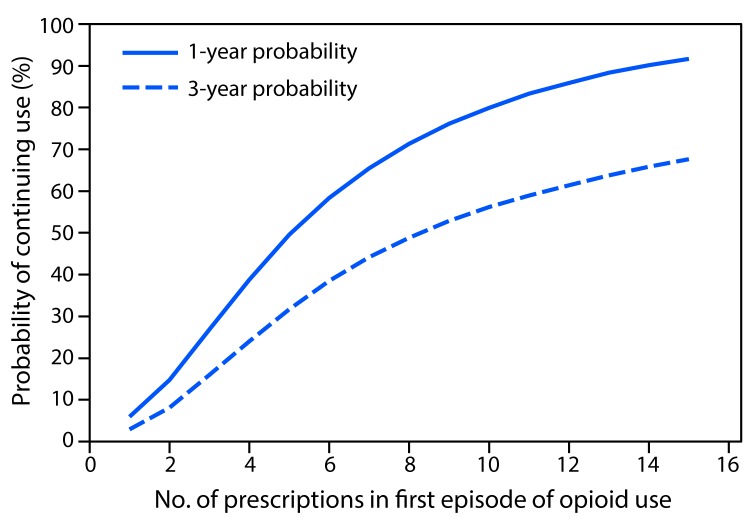
FIGURE 2.

The figure above is a line chart showing 1- and 3-year probabilities of continued opioid use among opioid-naïve patients, by number of prescriptions in the first episode of opioid use, in the United States during 2006–2015.

One- and 3-year probabilities of continued opioid use among opioid-naïve patients, by number of prescriptions* in the first episode of opioid use — United States, 2006–2015

* Number of prescriptions is expressed as 1–15, in increments of one prescription.