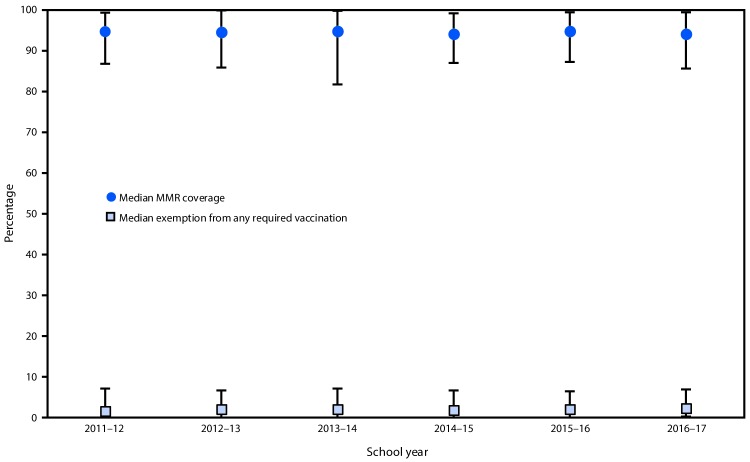
FIGURE.
Median and range* of measles, mumps, and rubella vaccine (MMR) coverage and exemptions from any required vaccination† among kindergartners — United States, 2011–12 to 2016–17 school years
Source: School Vaccination Assessment Program, 2011–12, 2012–13, 2013–14, 2014–15, 2015–16, and 2016–17 school years. https://www.cdc.gov/vaccines/vaxview/index.html.
* Data from local areas and territories are not included. Number of states whose data are included in the MMR coverage medians and ranges varied by year: 2011–12 (44 states); 2012–13 (46); 2013–14 (47); 2014–15 (50); 2015–16 (51); and 2016–17 (49). Number of states whose data are included in the exemption medians and ranges varied by year: 2011–12 through 2014–15 (46 states); 2015–16 (48); and 2016–17 (46).
† Represents the number of children who are exempt from any vaccination, not just MMR.

