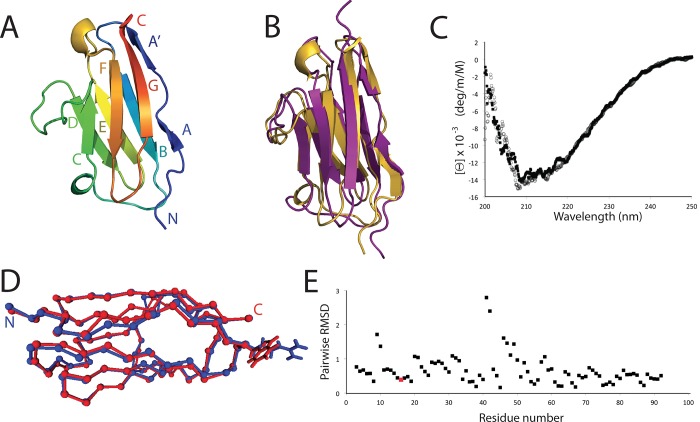
Fig 3. Structure and analysis of human obscurin Ig59.
A. Cartoon of the Ig59 crystal structure, showing the typical Ig-like fold. B. Comparison between the lowest RMSD Ig59 NMR structure and the X-ray structure. C. CD plot of WT obscurin Ig58-59 (black squares) and p.Arg4444Trp (open circles). D. MD simulated average models of WT (blue) and p.Arg4444Trp (red). Ca position. The side chains for Arg4444/Trp4444 are shown. E. RMSD vs residue number comparison of the mutant model to the wild-type model. The Arg4444Trp site is colored in red.

