
Figure 2. Type 2 cytokines activate itch-sensory pathways.
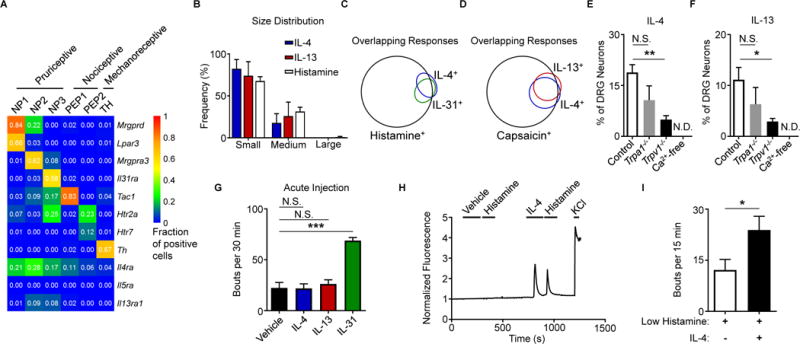
(A) Expression of selected genes in mouse DRG neuron populations clustered into functional subsets based on single-cell RNA-seq data. Numbers indicate fraction of positive cells within individual clusters by thresholding method. Full data set and methods available in Usoskin et al., 2015.
(B) Representative size distribution of rmIL-4-, rmIL-13-, and histamine-responsive mouse DRG neurons classified as small-, medium-, and large-diameter neurons (<18 μm, 18–25 μm, and >25 μm), n > 500 neurons from a WT mouse.
(C–D) Representative Venn diagrams of overlapping responses of mouse DRG neurons to stimulation with rmIL-4 with subsequent challenge with (C) rmIL-31 (300 nM) and histamine (50 μM) or with (D) rmIL-13 (4.0 μg/mL) and capsaicin (300 nM), n > 300 neurons from a WT mouse.
(E–F) Responses to (E) rmIL-4 (4 μg/mL) and (F) rmIL-13 (4 μg/mL) of mouse DRG neurons from Trpa1−/− mice, Trpv1−/− mice, and in calcium-free conditions as a percentage of total KCl-responsive neurons compared to WT control mice, n > 300 neurons per group.
(G) Total scratching bouts elicited in response to intradermal (i.d.) cheek injection of vehicle control (0.1% BSA in PBS, 10 μL), rmIL-4, rmIL-13, or rmIL-31 (all 2.5 μg/10 μL), n ≥ 5 mice per group.
(H) Representative calcium imaging trace of mouse DRG neurons responding to low levels of histamine (5 μM) after vehicle control or rmIL-4 (4 μg/mL) challenge, n > 200 neurons from 2 WT mice.
(I) Cheek-directed scratching bouts elicited in response to i.d. cheek injection of a low dose of histamine (4 mM, 10 μL) with or without rmIL-4 (2.5 μg), n ≥ 7 mice per group.
Data are represented as mean ± SEM. Black bars in calcium imaging traces indicate timing of challenges. See also Figure S2.