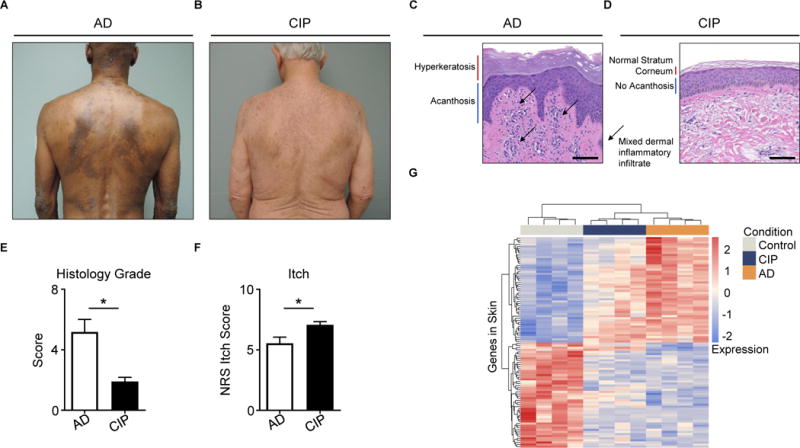
Figure 5. CIP is a distinct chronic itch disorder that exhibits severe itch despite minimal skin inflammation.

(A–B) Representative clinical pictures of (A) atopic dermatitis (AD) and (B) chronic idiopathic pruritus (CIP).
(C–D) Representative H&E histopathology of pruritic sites from (C) AD and (D) CIP.
(E) Histology score of AD and CIP patient biopsies, N ≥ 4 biopsies per group.
(F) Numerical Rating Scale (NRS) itch scores of AD and CIP patients, N ≥ 22 patients per group.
(G) Clustering of AD, CIP, and control skin samples by row Z-scores of the regularized logarithm of gene expression values of the top 100 differentially expressed genes from RNA-seq of AD versus control skin, N = 4 donors per condition.
Scale bars indicate 100 μm. Data are represented as mean ± SEM. See also Tables S1–S3.
