


Figure 4. Changes in reward-evoked activity of reward-responsive dopamine neurons (n = 48) to changes in reward identity.
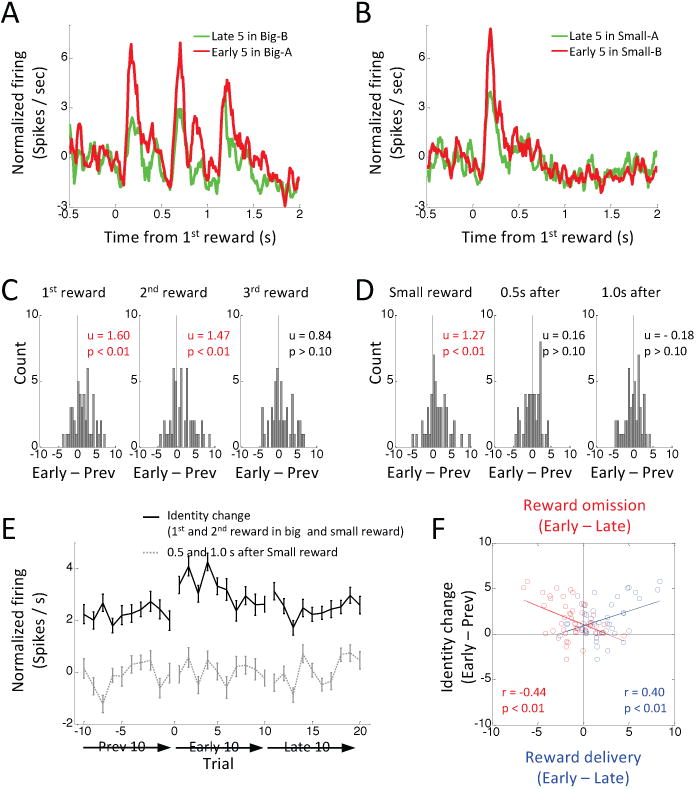
(A – B) Average firing on last 5 trials before (green) and first 5 trials after (red) a shift in reward identity for the big (A) and small (B) rewards. Big-A, 3 drops of reward A; Big-B, 3 drops of reward B; small-A, one drop of reward A; small-B, one drop of reward B. (C) Distributions of difference scores comparing firing to 1st (left), 2nd (middle) and 3rd drops (right) of the big reward in the last 5 versus first 5 trials before and after identity shift. (D) Distributions of difference scores comparing firing to the single drop of the small reward (left), and omissions of 2nd (middle) and 3rd drops (right) of the big reward in the last 5 versus first 5 small trials before and after an identity shift. Difference scores were computed from the average firing rate of each neuron. The numbers in each panel indicate results of Wilcoxon signed-rank test (p) and the average difference score (u). (E) Changes in average firing before and after reward identity shift. Black line indicates average firing at the time of the 1st and 2nd drops of the big reward and the small reward. Gray dashed line indicates average firing 0.5 s and 1.0 s after small reward. Error bars, S.E.M. (F) Correlation between changes in firing to shifts in reward identity, shown here, and changes in firing to delivery (blue dots) or omission (red dots) of the 2nd drop of the big reward, shown in Fig 3.