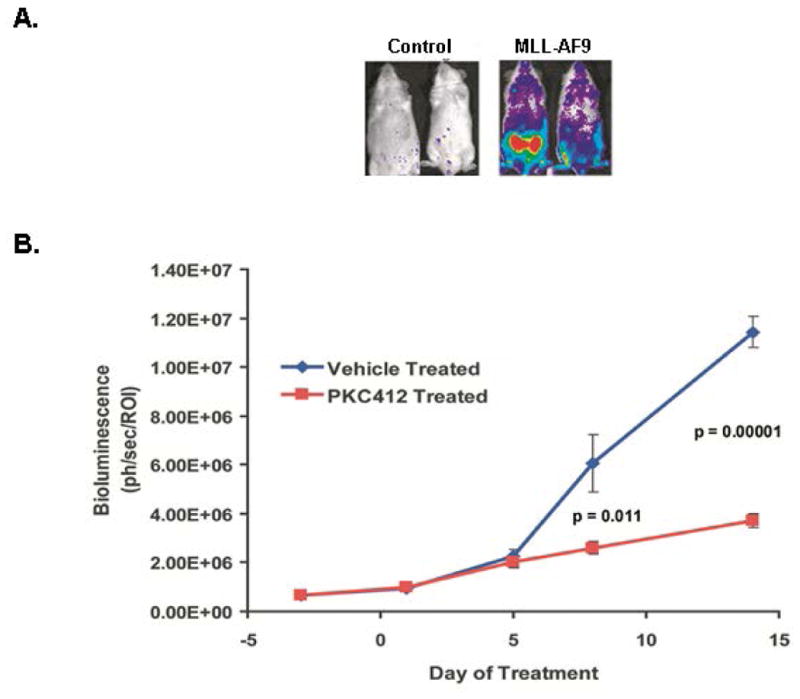
Figure 2. Monitoring bioluminescence for engraftment and drug efficacy.

A. The MLL-AF9 mice shown here expressed the Luciferase gene. At roughly 10 weeks post injection of cells, mice were imaged for bioluminescence using the Xenogen (Perkin Elmer) IVIS system. Also shown are control mice that were injected with Luciferase-expressing cells that did not receive the MLL-AF9 expression vector. B. Primary leukemias injected into secondary recipients were intraperitoneally dosed once daily with the pan- kinase inhibitor PKC412 at 150 mg/kg when mice achieved a mean baseline of roughly 106 photons/second/ROI. Shown is the graph of luminescence over time during treatment of these mice with PKC412 (Stubbs et al., 2008).
