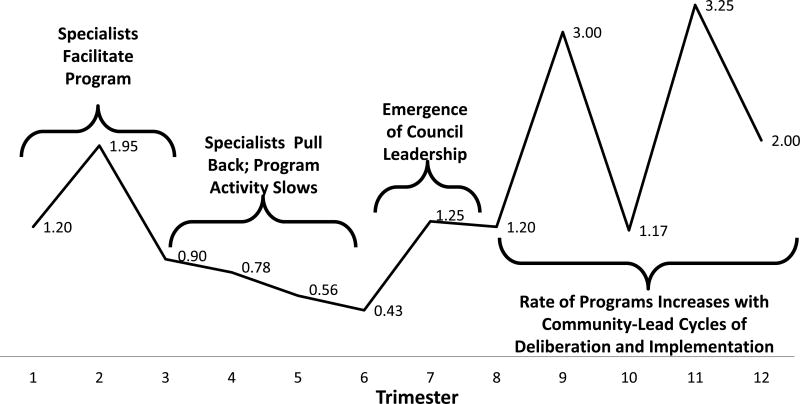
Figure 4. Mean Number of Programs per Council by Trimester of Activity.
Over the course of the implementation, Councils were assisted in planning interventions by HealthLink Specialists in the first year (trimesters 1–3), leading to a moderate average rate of program activity. After one year, our design required Specialists to shift activities from a given Council to start-up in new communities. During each Council’s second year (trimesters 4–6), the number of programs tended to diminish. By the third year (trimesters 7–9), activity picked up due to the emergence of local leadership and council’s increased experience. By the fourth year, average program activity increased substantially. Consistent with the comprehensive dynamic trial model, activities seemed to settle in to patterns of planning (lower rates) followed by implementation (higher rates). Note that the calendar for each Council began during different months, controlling for seasonal affects. This pattern of activity suggests that the HealthLink process fostered a sustainable mechanism for program planning and implementation.

