
Figure 1.
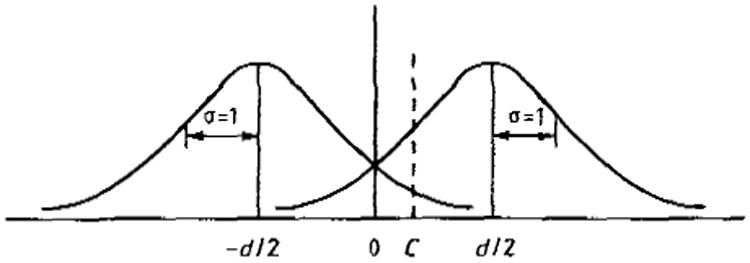
Distribution of filter outputs when s2 is present (left) and when s1 is present (right plotted against the tiller output. C, decision criterion; d, separation of means of the two distributions in units of their common standard deviation.
Official websites use .gov
A
.gov website belongs to an official
government organization in the United States.
Secure .gov websites use HTTPS
A lock (
) or https:// means you've safely
connected to the .gov website. Share sensitive
information only on official, secure websites.
Distribution of filter outputs when s2 is present (left) and when s1 is present (right plotted against the tiller output. C, decision criterion; d, separation of means of the two distributions in units of their common standard deviation.