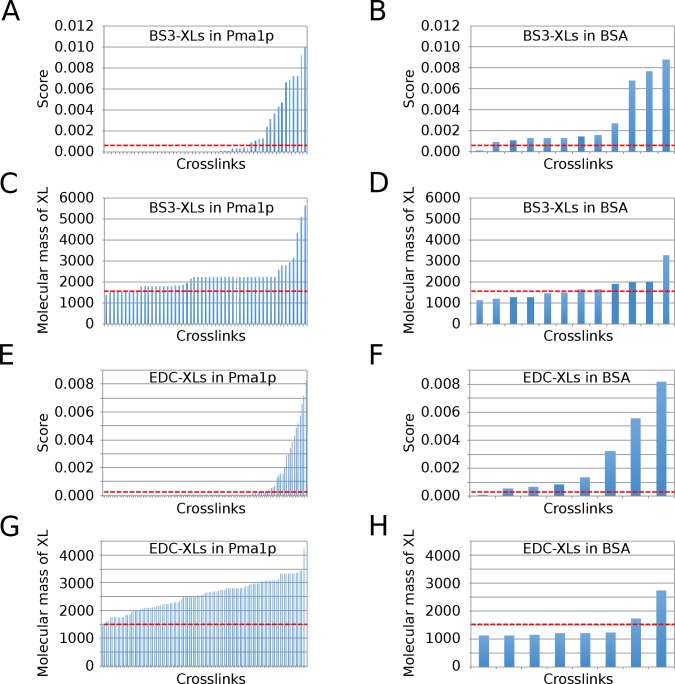
Fig 2. Molecular mass and scores of XLs found by pLink for Pma1p and BSA.
Distributions of scores and calculated molecular masses of XLs generated by pLink by scanning through all mgf files from BS3 experiments (A-D) or EDC experiments (E-H) for Pma1p and BSA, a protein that is not present in the sample, are plotted as calculated in S7 Table. The cut off lines used to filter all pLink XLs (stippled red lines) indicate a minimal molecular mass of XL of 1’500 Da and scores of ≤ 7.5 x 10⁻⁴ for BS3-XLs, or ≤ 4 x 10⁻⁴ for EDC-XLs.

