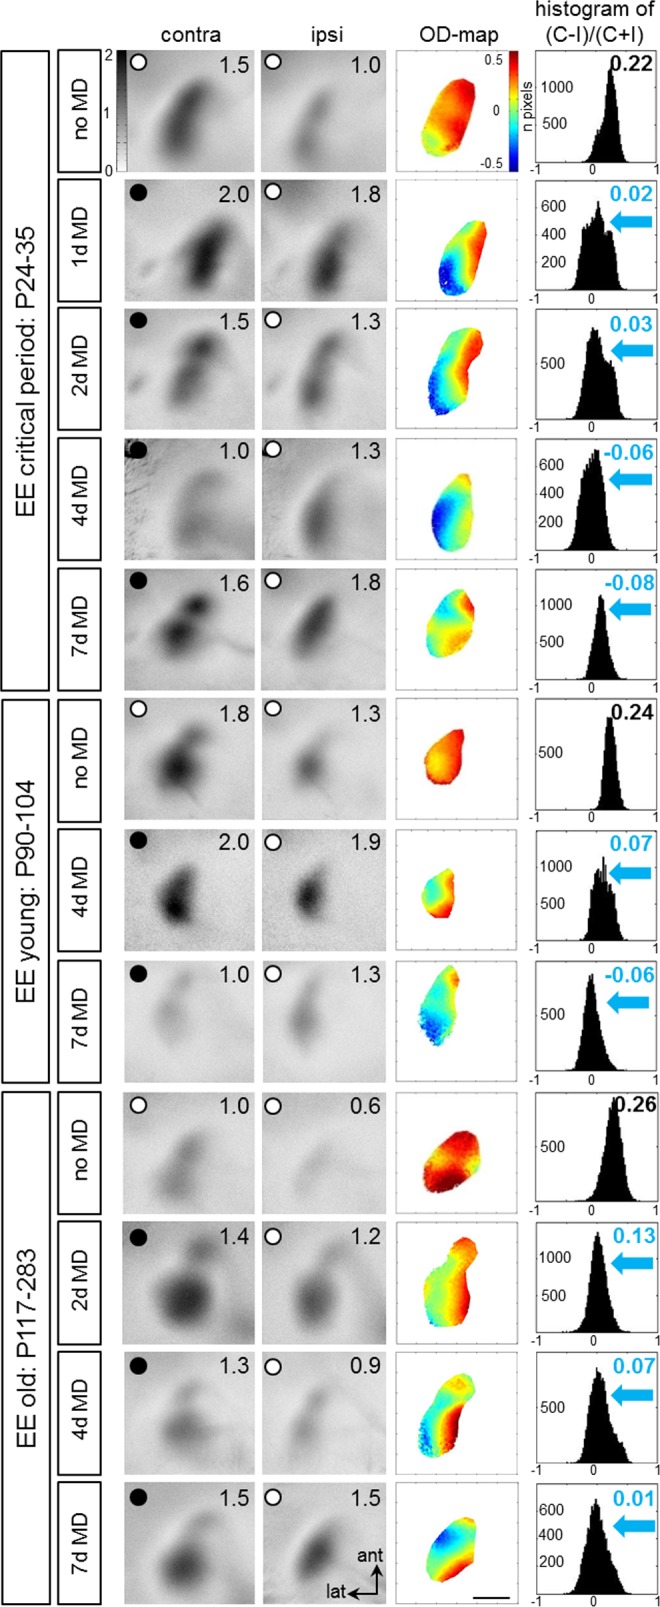
Fig 1. Accelerated ocular dominance (OD) shifts in V1 of enriched environment (EE) mice.

Representative examples of optically recorded activity maps in the binocular region of V1 of animals of three different age groups: critical period (P24-35), young (P90-104) and old EE-mice (P117-283), before and after 1, 2, 4 or 7 days (d) of monocular deprivation (MD). Grayscale-coded V1-activity maps (neuronal activation expressed as fractional change in reflectance ×10−4) after contralateral (contra) and ipsilateral (ipsi) eye stimulation (numbers correspond to quantified V1-activation of the illustrated example), color-coded 2-dimensional OD-maps and the histogram of OD-scores, including the average ocular dominance index (ODI) are illustrated. Without MD, activity patches evoked by stimulation of the contralateral eye were darker than those of the ipsilateral eye, the average ODI was positive, and warm colors prevailed in the OD-maps, indicating contralateral dominance. MD of 1–2 days already induced strong OD-shifts towards the open eye: after MD, contra- and ipsilateral eye stimulation activated V1 about equally strong, colder colors appeared in the OD-map, and the histogram of OD-scores shifted to the left (blue arrows). Scale bar: 1 mm.
