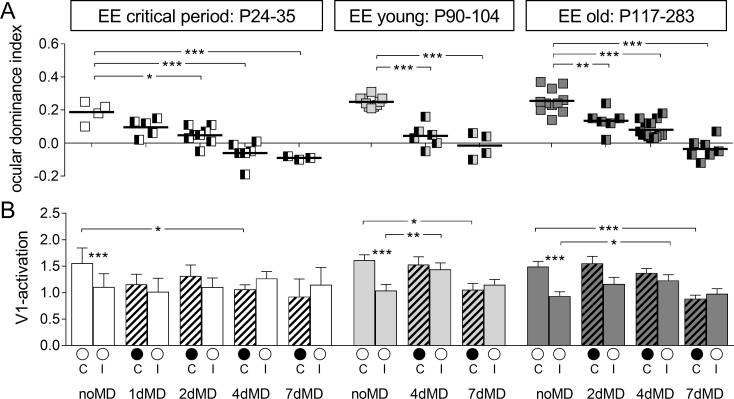
Fig 2. Quantification of optically recorded V1-activation in enriched environment-mice of three different age groups before and after varying monocular deprivation durations.
A. Optically imaged ODIs of critical period, young and old enriched environment (EE) mice. Symbols represent individual ODI-values, means are marked by horizontal lines; values after monocular deprivation (MD) are indicated by half-black squares. B. V1-activation elicited by stimulation of the contralateral (C) or ipsilateral (I) eye without and with MD (black filled circle indicates MD eye).

