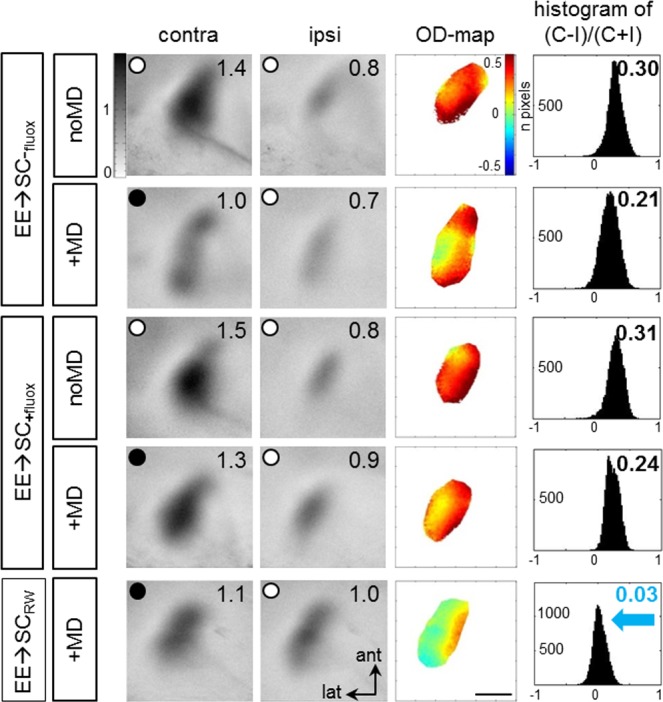
Fig 6. Adding a running wheel to standard cages but not fluoxetine treatment rescued ocular dominance plasticity after transferring EE-mice to SCs (EE→SC).

Examples of V1-activity maps and their quantification recorded from EE-mice transferred to SCs: EE->SC-mice without treatment (upper 2 rows), with fluoxetine treatment (3rd and 4th row), or with added RW in the SCs (5th row). Layout and data display as in Fig 1. MD only induced an OD-shift in V1 of the RW-group (EE→SCRW): after MD, the contra- and ipsilateral eye activated V1 about equally strong, colder colors appeared in the OD-map, and the histogram of OD-scores shifted to the left (blue arrow). In all other groups, including those treated with fluoxetine, V1 remained dominated by input from the contralateral (deprived) eye: contralateral eye evoked activity patches were darker than those of the ipsilateral eye, the average ODI was positive, and warm colors prevailed in the OD-maps. Scale bar: 1 mm.
