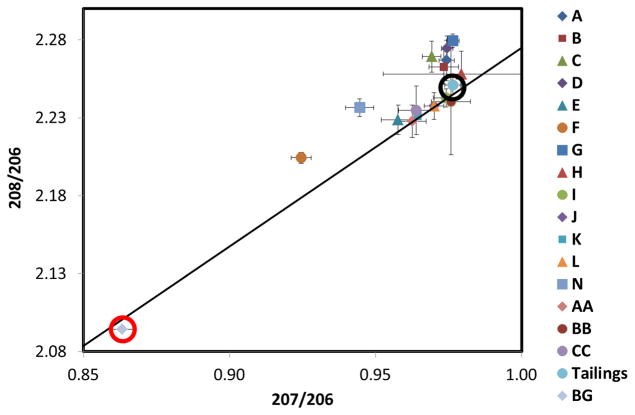
Figure 12.
Lead isotopic ratios 208Pb/206Pb and 207Pb/206Pb for each inverted-disc sampler and a sample of tailings topsoil for the 11 June to 9 July 2014 sampling period. The letters represent the inverted-disc sample locations from Figure 1. Tailings (surrounded by a black circle), represent “fingerprint” ratios of the source. The background sample (BG, surrounded by a red circle), corresponds to topsoil (0–3 mm) collected 5 km from the source and represents the natural Pb isotopic “fingerprint” of the region. Error bars represent standard deviations from triplicate samples. Additionally included is the growth curve (solid line) adapted from Chen et al. [23].

