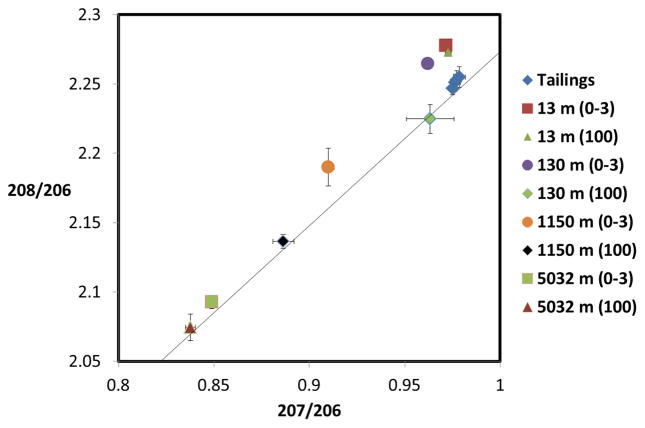
Figure 14.
Lead isotopic ratios for soil samples at different distances from the mine tailings (indicated). Numbers in parentheses represent the depth of the sample in mm. Error bars represent standard deviations from triplicate samples. Additionally included is the growth curve (solid line) adapted from Chen et al. [23].

