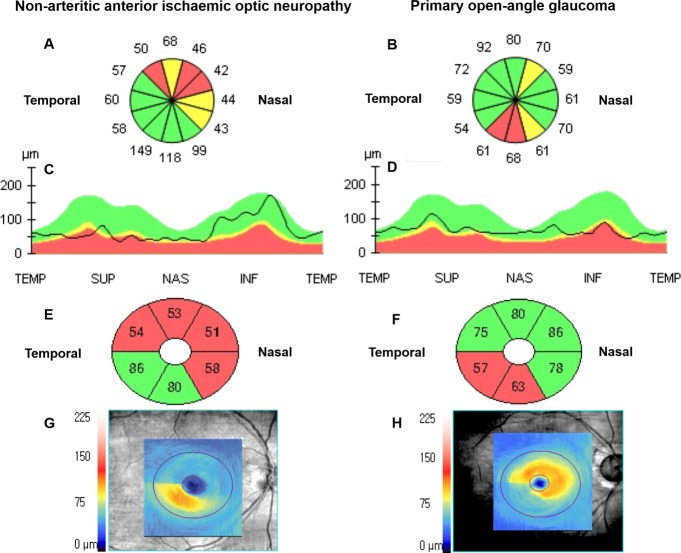
Fig 2.
Optical coherence tomography analysis reports of a representative case of NAION (A, C, E, G) and an age- and average RNFL thickness-matched case of POAG (B, D, F, H). Average RNFL thicknesses of the NAION and POAG were 69 and 67 μm, respectively. (A, B) Clock-hour RNFL thickness map and (C, D) RNFL thickness profile (TEMP: temporal, 9 o’clock; SUP: superior, 12 o’clock; NAS: nasal, 3 o’clock; and INF: inferior, 6 o’clock) show that significant thinning (coloured red or yellow) is distributed in the superior and nasal regions in NAION, and is located in the inferior region in POAG. (E, F) Sectoral macular GCIPL thickness map and (G, F) GCIPL map show that the significantly thinning area in NAION was larger than that in POAG. Average GCIPL thicknesses in NAION and POAG were 64 and 73 μm, respectively.

