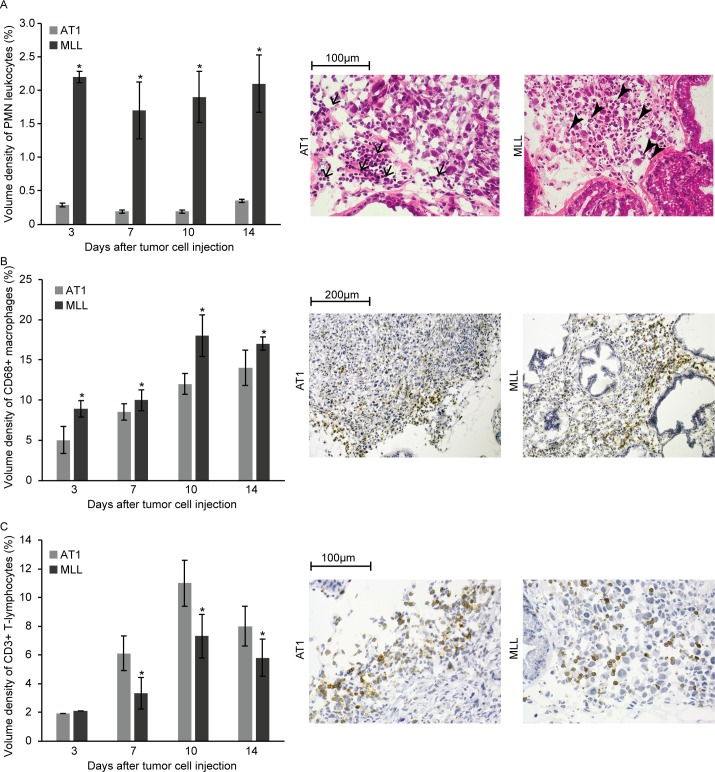
Fig 2. Inflammatory cells at the invasive zone of AT1- and MLL-tumors at different time points post injection of tumor cells.
A) Volume density of polymorphonuclear leukocytes (PMNs) at the invasive zone. Representative eosin-hematoxylin stained sections showing AT1- and MLL-tumors at day 3 post tumor cell injection. Note the difference in the recruited inflammatory cells with mainly PMNs (arrowheads) in MLL-tumors, and lymphocytes (arrows) in AT1-tumors. B) Volume density CD68+ macrophages at the invasive zone. Representative sections showing CD68 staining (brown) in AT1- and MLL-tumors at day 3. C) Volume density of CD3+ T-lymphocytes in the tumor invasive zone. Representative sections showing CD3 staining in AT1- and MLL-tumors at day 7. Bars represent mean +/- SD, n = 7–8 animals/group, * p < 0.05.

