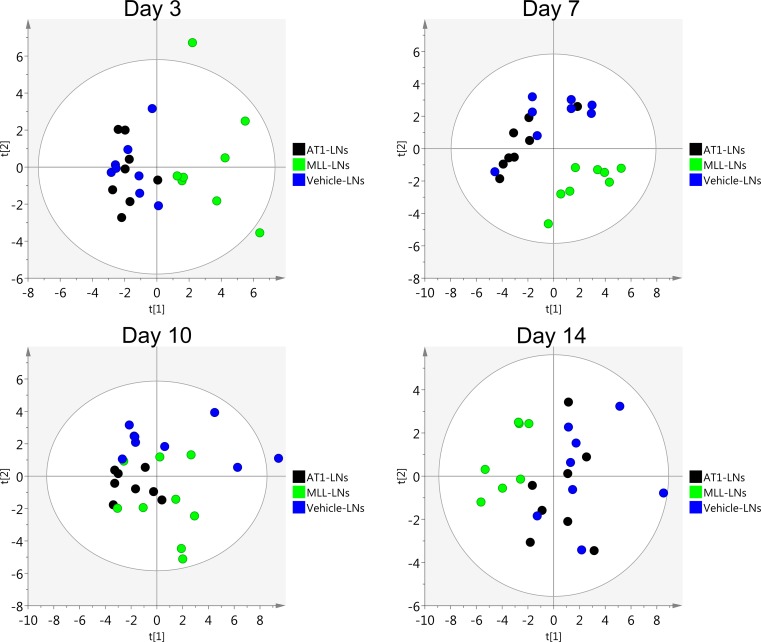
Fig 9. Principal component analysis.
Score plots showing the variability explained by the 1st and 2nd components of a PCA-model constructed using log2 transformed relative gene expression values in vehicle-, AT1- and MLL-LNs at day 3, 7, 10 and 14 after injection of tumor cells/vehicle into the prostate (n = 7–9 animal/group).

