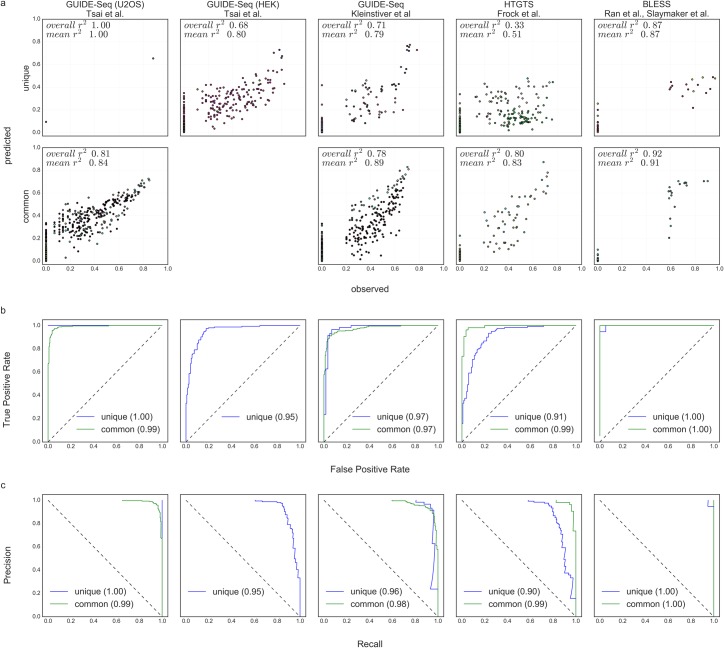
Fig 3. Accuracy across different studies in a leave-study-out cross-validation.
(a) Observed cleavage intensities versus predicted intensities. The top and bottom rows represent the nuclear targets of the ‘unique guides’ and ‘common guides’, respectively. Pearson r2 values are shown; "overall" represents the correlation calculated by taking all points, and "mean" is the average correlation calculated for each sgRNA individually. Different colors represent nuclear targets of different sgRNAs. (b, c) ROC and PRC curves. The ‘unique guides’ and ‘common guides’ of each study are represented by different curves. AUC values are denoted in the legend. Each column corresponds to a single experimental platform.

