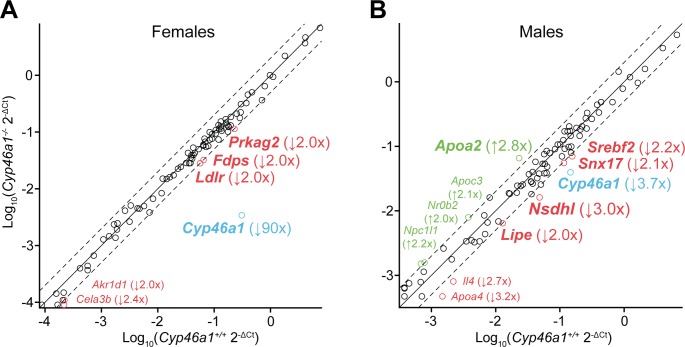
Fig 3. Profiling of cholesterol-related genes in the Cyp46a1-/- brain by PCR array.
A) Female 3–4 month old mice. B) Male 3–4 month old mice. For both female and male mice, a pooled sample of 3 brain hemispheres from different mice was used. Each circle indicates an individual gene in the PCR array. The up-regulated and down-regulated genes are in green and red, respectively (cutoff, 2.0, dashed line), and those with Ct numbers ≤ 30 are in bold. Genes in blue are those which were downregulated in both genders. The number in parenthesis indicates a fold change as compared to the wild type brain. Gene abbreviations are deciphered in S1 Text.

