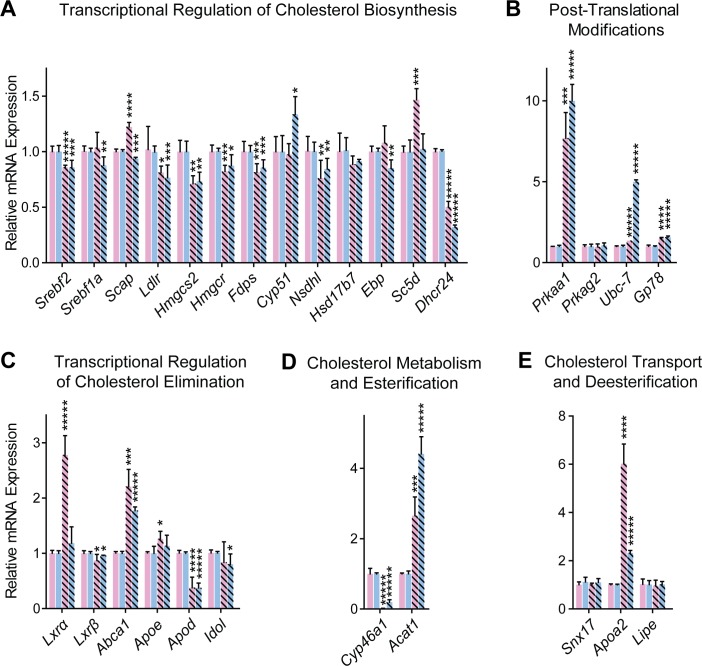
Fig 4. Evaluation of gene expression in the Cyp46a1-/- brain by qRT-PCR.
Genes are grouped based on function of the encoded proteins in cholesterol homeostasis. Each bar represents the mean ± SD of the PCR reactions performed individually on 3 to 6 animals in duplicate. The color code is the same as in Fig 2. Black asterisks indicate statistical significance between Cyp46a1-/- and wild type mice of the same gender as assessed by a two-tailed, unpaired Student’s t-test. *, P≤0.05; **, P≤0.01; ***, P≤0.001; ****, P≤0.0001; and *****, P≤0.00001.

