
Fig 3.
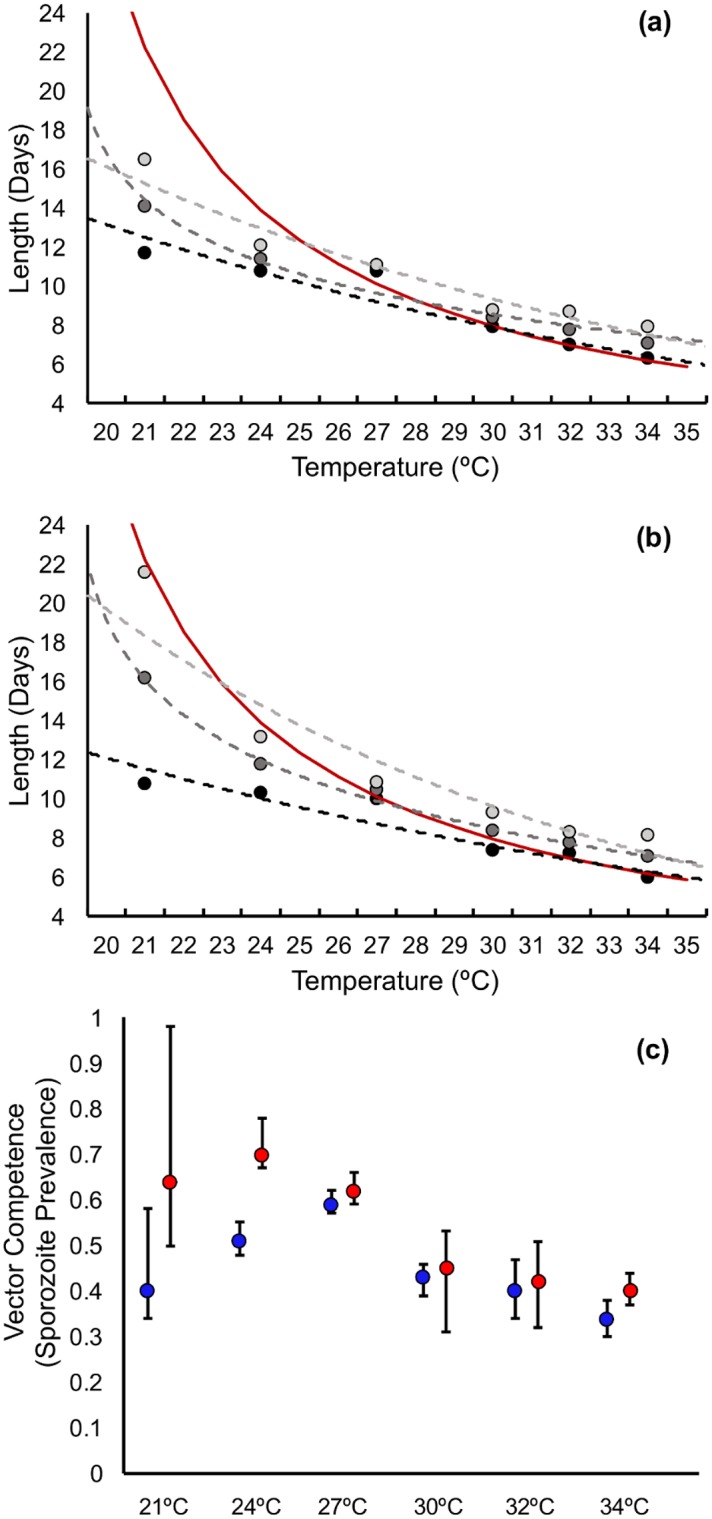
Predicted values for EIP10 (light grey), EIP50 (grey), and EIP90 (black) for each temperature in (A) experimental block 1 and (B) experimental block 2; dotted lines represent the predicted thermal performance curve for the respective EIPs, while the red line is the EIP of P. falciparum predicted from the widely-used degree-day model of Detinova 1962 [27]. (C) Predicted values for vector competence (g, the asymptote of the sporogony curve in Fig 2) across temperature for block 1 (blue) and block 2 (red). Error bars represent 95% confidence intervals. Numerical values can be accessed at http://dx.doi.org/10.5061/dryad.74389 [34]. EIP, extrinsic incubation period.