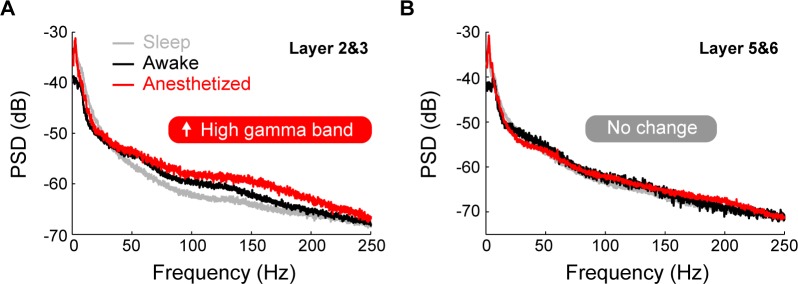
Fig 11. Average local field potential power spectra under the quiet awake, sleep and ketamine-induced anesthetized states.
(A) Layer 2&3. (B) Layer 5&6. Gray curves, black curves and red curves represent the average local field potential power spectra under the quiet awake, sleep, and ketamine-induced anesthetized states.

