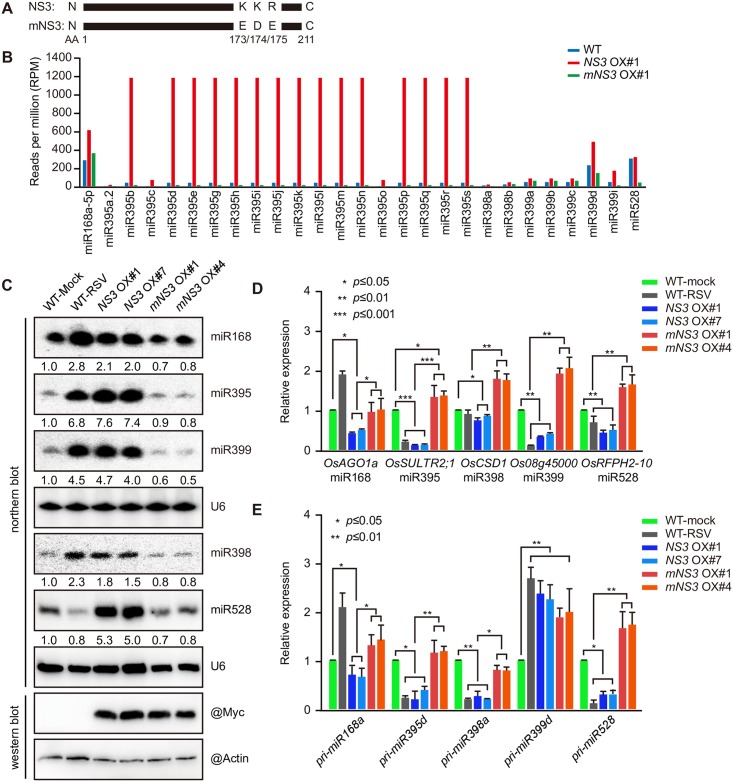
Fig 2. Expression of NS3 promotes the accumulation of several miRNAs and reduces the expression of their targets.
(A) Mutation site of the mutant NS3 (mNS3). (B) Measurement of miRNA (miR168, 395, 398, 399, and 528) accumulation in the WT, NS3 OX#1, and mNS3 OX#1 rice lines by small RNA sequencing. (C) Detection of miRNA (miR168, 395, 398, 399, and 528) accumulations in mock-infected, RSV-infected (RSV), NS3 OX#1, NS3 OX#7, mNS3 OX#1, and mNS3 OX#4 rice plants by northern blotting. U6 served as a loading control, the expression levels in the WT-Mock plants are set to a value of 1.0 and the expression levels of in the other plants are relative to this reference value. (D) Relative expression levels of the target genes of the miRNAs (miR168, 395, 398, 399, and 528), including OsAGO1a, OsSULTR2;1, OsCSD1, Os08g45000, and OsRFPH2-10 in the mock-infected, RSV-infected (RSV), NS3 OX#1, NS3 OX#7, mNS3 OX#1, and mNS3 OX#4 rice plants. (E) Relative expression levels of the miRNA (miR168, 395, 398, 399, and 528) precursors, including pri-miR168a, pri-miR395d, pri-miR398a, pri-miR399b, and pri-miR528 in the mock-infected, RSV-infected (RSV), NS3 OX#1, NS3 OX#7, mNS3OX#1, and mNS3 OX#4 rice plants. Average (± SD) values based on RT-qPCR analysis of three biological replicates are shown. ***, P ≤ 0.001; **, P ≤ 0.01; *, P ≤ 0.05.

