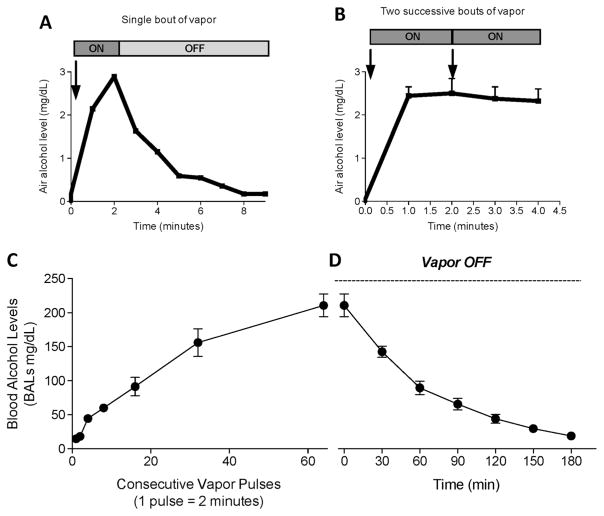
Fig. 2.
a Air alcohol levels after one nosepoke (2 min of vapor). b Air alcohol levels after two consecutive nosepokes (2 + 2 min of vapor). Blood alcohol levels (c) during 1 h of consecutive vapor pulses (1 pulse = 2 min) and d) in the successive 3 h after discontinuing alcohol vapor. The data are expressed as mean ± SEM

