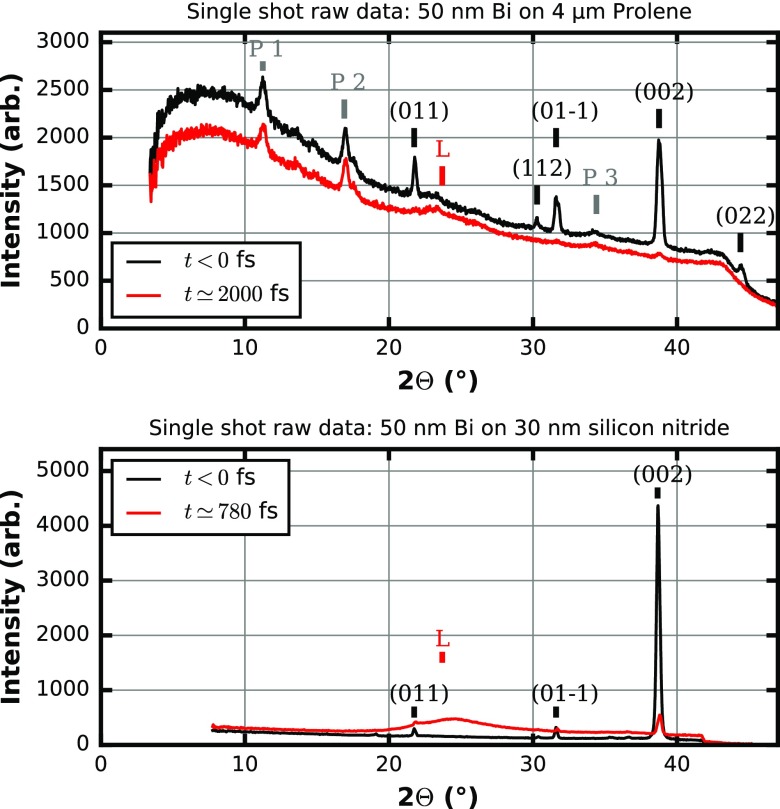
FIG. 6.
1-D representation of Bragg-angle Θ vs. intensity of single shot data by radial integration of the 2-D raw images for two different samples and two pump-probe time points, respectively. The scattering features are labeled by P if related to Prolene, by the corresponding Miller-indices according to Wyckoff et al.51 if related to the Bi lattice and with L for the signal of a liquid Bi phase. The visibility and intensity of the peaks are dependent on the X-ray energy and change at a different wavelength. (Top) 50 nm Bi sample on 4 μm Prolene substrate: Two different time points for the pump-probe delay of 2000 fs after T0 (optical laser first) and negative time delay (FEL probe first, no dynamics). (Bottom) 50 nm Bi sample on 30 nm silicon nitride substrate: Two different time points for the pump-probe delay of 780 fs after T0 (optical laser first) and negative time delay (FEL probe first, no dynamics). The onset of melting can be readily observed in a single shot.

