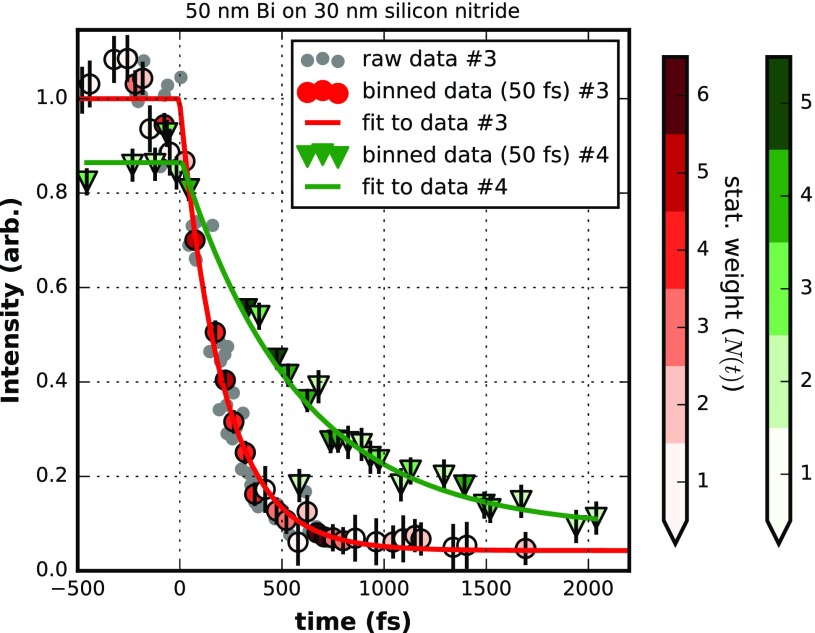
FIG. 8.
Dynamic data of the (200) peak diffraction intensity from 50 nm Bi on 30 nm silicon nitride support for two different laser fluences of 150 mJ/cm2 (data #3) and 60 mJ/cm2 (data #4). For the dataset #3 the raw data is depicted for reference. Binning in 50 fs intervals produces data which is fitted by a piecewise exponential decay (see text). Fit parameters of dataset #3: tau = (213 ± 12) fs, T0 = (0 ± 8) fs, a = 1.000 ± 0.012, c = 0.043 ± 0.010; dataset #4: tau = (571 ± 67) fs, T0 = (14 ± 32) fs, a = 0.865 ± 0.021, c = 0.087 ± 0.03. The color coding of the binned data points represents the statistical weight, which is the number of single shots summed in a bin. Error bars attached to the binned data are estimates from the fit results and for reference only. They are not used during evaluation. The Y-error of the single raw data points is around ±0.05. The X-axis is arbitrary in offset and here calibrated by dataset #3.

