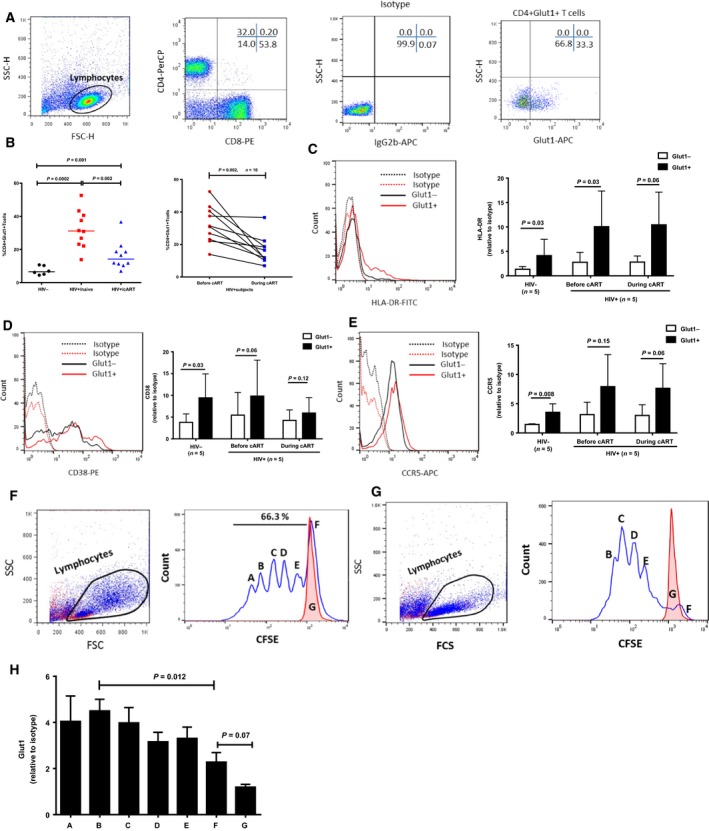
Figure 1.

Glut1 cell surface expression on CD4+ T cells is associated with markers of proliferation and activation. (A) Representative flow cytometric dot plots of PBMCs from an HIV+/cART subject. Lymphocytes (circled) were defined using side scatter (SSC) and forward scatter (FSC) characteristics. The gating strategy shows T cells defined based on CD4 and CD8 surface expression. A representative Glut1‐isotype, and Glut1 antibody staining on CD4+ T cells in peripheral blood from HIV+/cART subjects. (B) Percentage of CD4+Glut1+ T cells in peripheral blood from HIV‐negative, HIV+/naive, and HIV+/cART subjects (left panel). Same subjects as in left panel showing percentages of CD4+Glut1+ T cells before and during cART (right panel). (C) Representative histogram (left panel) and aggregate plot (right panel) of HLA‐DR expression on CD4+Glut1+ and CD4+Glut1− T cell from HIV+ subjects. (D) Representative histogram (left panel) and aggregate plot (right panel) of CD38 expression on CD4+Glut1+ and CD4+Glut1− T cell from HIV+ subjects. (E) Representative histogram (left panel) and aggregate plot (right panel) of CCR5 expression on CD4+Glut1+ and CD4+Glut1− T cell from HIV+ subjects. 5 HIV− and 5 HIV+ subjects were analyzed for all surface markers. (F, G) Representative dot plots showing forward and side scatter properties of PBMCs from two HIV‐negative subject stimulated with 10 μg·mL−1 PHA plus 5 ng·mL−1 IL‐2 for 4 days (blue dots), or cultured without stimulation for the same amount of time (red dots) (left panel). (Right panels) Cells were labeled with CFSE on day 1 as described in Methods, and representative plots of CFSE‐labeled CD4+ T cells after 4 days of incubation with PHA plus IL‐2 (blue line) or unstimulated (red line). (H) The bar chart indicates the cumulative MFI of Glut1 relative to isotype control on CD4+ T cells within each corresponding peak (A–G) showing different rounds of CD4+ T cell replication, and peak G (red) showing CD4+ T cells from unstimulated PBMCs. Cumulative results are obtained from 4 to 5 peaks depending on the amount of cell division. The paired t‐test was used to measure significant differences within groups.
